IHOP 2011 Annual Report Download - page 65
Download and view the complete annual report
Please find page 65 of the 2011 IHOP annual report below. You can navigate through the pages in the report by either clicking on the pages listed below, or by using the keyword search tool below to find specific information within the annual report.-
 1
1 -
2
-
3
-
4
-
5
-
6
-
7
-
8
-
9
-
10
-
11
-
12
-
13
-
14
-
15
-
16
-
17
-
18
-
19
-
20
-
21
-
22
-
23
-
24
-
25
-
26
-
27
-
28
-
29
-
30
-
31
-
32
-
33
-
34
-
35
-
36
-
37
-
38
-
39
-
40
-
41
-
42
-
43
-
44
-
45
-
46
-
47
-
48
-
49
-
50
-
51
-
52
-
53
-
54
-
 55
55 -
 56
56 -
 57
57 -
 58
58 -
 59
59 -
 60
60 -
 61
61 -
 62
62 -
 63
63 -
 64
64 -
 65
65 -
 66
66 -
 67
67 -
 68
68 -
 69
69 -
 70
70 -
 71
71 -
 72
72 -
 73
73 -
 74
74 -
 75
75 -
76
-
77
-
78
-
79
-
80
-
81
-
82
-
83
-
84
-
85
-
86
-
87
-
88
-
89
-
90
-
91
-
92
-
93
-
94
-
95
-
96
-
97
-
98
-
99
-
100
-
101
-
102
-
103
-
104
-
105
-
106
-
107
-
108
-
109
-
110
-
111
-
112
-
113
-
114
-
115
-
116
-
117
-
118
-
119
-
120
-
121
-
122
-
123
-
124
-
125
-
126
-
127
-
128
-
129
-
130
-
131
-
132
-
133
-
134
-
135
-
136
-
137
-
138
-
139
-
140
-
141
-
142
 |
 |

47
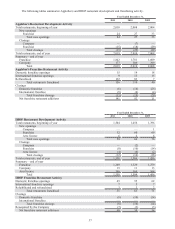
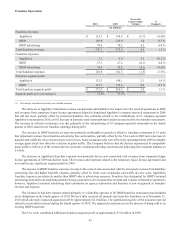
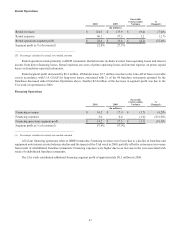
Rental Operations
Rental revenues
Rental expenses
Rental operations segment profit
Segment profit as % of revenue(1)
2010
(In millions)
$ 124.5
96.1
$ 28.4
22.8%
2009
$ 133.9
97.3
$ 36.6
27.3%
Favorable
(Unfavorable)
Variance
$(9.4)
1.2
$(8.2)
%
Change(1)
(7.0)%
1.2 %
(22.4)%
_________________________________________
(1) Percentages calculated on actual, not rounded, amounts
Rental operations relate primarily to IHOP restaurants. Rental income includes revenue from operating leases and interest
income from direct financing leases. Rental expenses are costs of prime operating leases and interest expense on prime capital
leases on franchisee-operated restaurants.
Rental segment profit decreased by $8.2 million. Of that decrease, $5.7 million was due to the write-off of lease receivable
cost in accordance with U.S. GAAP for long-term leases, associated with 21 of the 40 franchise restaurants operated by the
franchisee discussed under Franchise Operations above. Another $2.4 million of the decrease in segment profit was due to the
53rd week of operations in 2009.
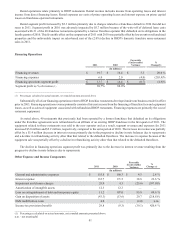
Financing Operations
Financing revenues
Financing expenses
Financing operations segment profit
Segment profit as % of revenue(1)
2010
(In millions)
$ 16.2
2.0
$ 14.2
87.9%
2009
$ 17.9
0.4
$ 17.5
97.9%
Favorable
(Unfavorable)
Variance
$(1.7)
(1.6)
$(3.3)
%
Change(1)
(9.2)%
(431.9)%
(18.5)%
________________________________________
(1) Percentages calculated on actual, not rounded, amounts
All of our financing operations relate to IHOP restaurants. Financing revenues were lower due to a decline in franchise and
equipment note interest as note balances decline and the impact of the 53rd week in 2009, partially offset by an increase in revenue
from resale of rehabilitated franchise restaurants. Financing expenses were higher due to an increase in the cost associated with
resale of rehabilitated franchise restaurants.
The 53rd week contributed additional financing segment profit of approximately $0.3 million in 2009.