Hertz 2013 Annual Report Download - page 83
Download and view the complete annual report
Please find page 83 of the 2013 Hertz annual report below. You can navigate through the pages in the report by either clicking on the pages listed below, or by using the keyword search tool below to find specific information within the annual report.-
 1
1 -
2
-
3
-
4
-
5
-
6
-
7
-
8
-
9
-
10
-
11
-
12
-
13
-
14
-
15
-
16
-
17
-
18
-
19
-
20
-
21
-
22
-
23
-
24
-
25
-
26
-
27
-
28
-
29
-
30
-
31
-
32
-
33
-
34
-
35
-
36
-
37
-
38
-
39
-
40
-
41
-
42
-
43
-
44
-
45
-
46
-
47
-
48
-
49
-
50
-
51
-
52
-
53
-
54
-
55
-
56
-
57
-
58
-
59
-
60
-
61
-
62
-
63
-
64
-
65
-
66
-
67
-
68
-
69
-
70
-
71
-
72
-
 73
73 -
 74
74 -
 75
75 -
 76
76 -
 77
77 -
 78
78 -
 79
79 -
 80
80 -
 81
81 -
 82
82 -
 83
83 -
 84
84 -
 85
85 -
 86
86 -
 87
87 -
 88
88 -
 89
89 -
 90
90 -
 91
91 -
 92
92 -
 93
93 -
94
-
95
-
96
-
97
-
98
-
99
-
100
-
101
-
102
-
103
-
104
-
105
-
106
-
107
-
108
-
109
-
110
-
111
-
112
-
113
-
114
-
115
-
116
-
117
-
118
-
119
-
120
-
121
-
122
-
123
-
124
-
125
-
126
-
127
-
128
-
129
-
130
-
131
-
132
-
133
-
134
-
135
-
136
-
137
-
138
-
139
-
140
-
141
-
142
-
143
-
144
-
145
-
146
-
147
-
148
-
149
-
150
-
151
-
152
-
153
-
154
-
155
-
156
-
157
-
158
-
159
-
160
-
161
-
162
-
163
-
164
-
165
-
166
-
167
-
168
-
169
-
170
-
171
-
172
-
173
-
174
-
175
-
176
-
177
-
178
-
179
-
180
-
181
-
182
-
183
-
184
-
185
-
186
-
187
-
188
-
189
-
190
-
191
 |
 |

Table of Contents
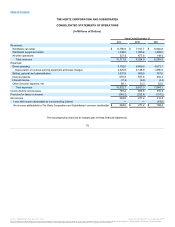
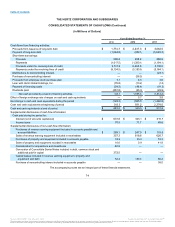
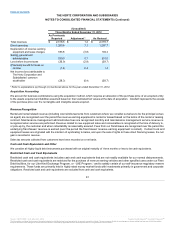
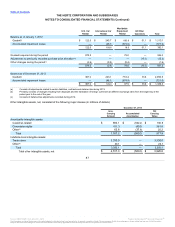
Total revenues
$4,186.1
$1.9
$4,188.0
Direct operating
2,303.1
6.2
2,309.3
Depreciation of revenue earning
equipment and lease charges
1,034.9
(11.7)
1,023.2
Selling, general and administrative
414.3
18.0
432.3
Income before income taxes
147.6
(10.6)
137.0
(Provision) benefit for taxes on income
(94.9)
5.6
(89.3)
Net income (loss) attributable to The
Hertz Corporation and Subsidiaries'
common stockholder
52.7
(5.0)
47.7
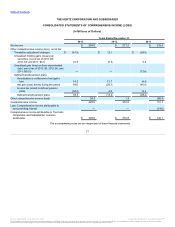
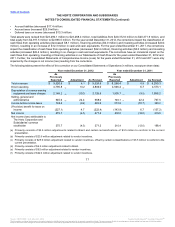
Total revenues
$2,516.2
$1.0
$2,517.2
$6,702.3
$2.9
$6,705.2
Direct operating
1,241.1
(3.1)
1,238.0
3,544.2
3.1
3,547.3
Depreciation of revenue
earning equipment and
lease charges
560.5
(3.8)
556.7
1,595.4
(15.5)
1,579.9
Selling, general and
administrative
201.0
3.7
204.7
615.3
21.7
637.0
Income before income
taxes
382.1
4.2
386.3
529.7
(6.4)
523.3
(Provision) benefit for taxes
on income
(130.8)
(3.3)
(134.1)
(225.7)
2.3
(223.4)
Net income (loss)
attributable to The Hertz
Corporation and
Subsidiaries' common
stockholder
251.3
0.9
252.2
304.0
(4.1)
299.9
80
Source: HERTZ CORP, 10-K, March 31, 2014 Powered by Morningstar® Document Research℠
The information contained herein may not be copied, adapted or distributed and is not warranted to be accurate, complete or timely. The user assumes all risks for any damages or losses arising from any use of this information,
except to the extent such damages or losses cannot be limited or excluded by applicable law. Past financial performance is no guarantee of future results.