Hertz 2013 Annual Report Download - page 80
Download and view the complete annual report
Please find page 80 of the 2013 Hertz annual report below. You can navigate through the pages in the report by either clicking on the pages listed below, or by using the keyword search tool below to find specific information within the annual report.-
 1
1 -
2
-
3
-
4
-
5
-
6
-
7
-
8
-
9
-
10
-
11
-
12
-
13
-
14
-
15
-
16
-
17
-
18
-
19
-
20
-
21
-
22
-
23
-
24
-
25
-
26
-
27
-
28
-
29
-
30
-
31
-
32
-
33
-
34
-
35
-
36
-
37
-
38
-
39
-
40
-
41
-
42
-
43
-
44
-
45
-
46
-
47
-
48
-
49
-
50
-
51
-
52
-
53
-
54
-
55
-
56
-
57
-
58
-
59
-
60
-
61
-
62
-
63
-
64
-
65
-
66
-
67
-
68
-
69
-
 70
70 -
 71
71 -
 72
72 -
 73
73 -
 74
74 -
 75
75 -
 76
76 -
 77
77 -
 78
78 -
 79
79 -
 80
80 -
 81
81 -
 82
82 -
 83
83 -
 84
84 -
 85
85 -
 86
86 -
 87
87 -
 88
88 -
 89
89 -
 90
90 -
91
-
92
-
93
-
94
-
95
-
96
-
97
-
98
-
99
-
100
-
101
-
102
-
103
-
104
-
105
-
106
-
107
-
108
-
109
-
110
-
111
-
112
-
113
-
114
-
115
-
116
-
117
-
118
-
119
-
120
-
121
-
122
-
123
-
124
-
125
-
126
-
127
-
128
-
129
-
130
-
131
-
132
-
133
-
134
-
135
-
136
-
137
-
138
-
139
-
140
-
141
-
142
-
143
-
144
-
145
-
146
-
147
-
148
-
149
-
150
-
151
-
152
-
153
-
154
-
155
-
156
-
157
-
158
-
159
-
160
-
161
-
162
-
163
-
164
-
165
-
166
-
167
-
168
-
169
-
170
-
171
-
172
-
173
-
174
-
175
-
176
-
177
-
178
-
179
-
180
-
181
-
182
-
183
-
184
-
185
-
186
-
187
-
188
-
189
-
190
-
191
 |
 |

Table of Contents
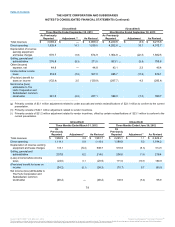
•Accrued liabilities (decreased $17.4 million)
•Accrued taxes (increased $25.9 million)
•Deferred taxes on income (decreased $13.3 million)
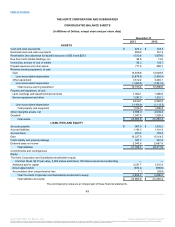
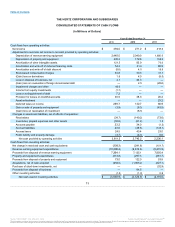
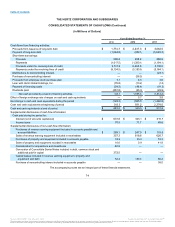
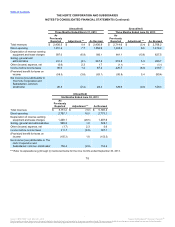
Total assets were revised from $23,290.1 million to $23,268.4 million, total liabilities from $20,372.6 million to $20,371.9 million, and
total equity from $2,917.5 million to $2,896.5 million. For the year ended December 31, 2012, the corrections impact the classification of
cash flows from operating activities (decreased $8.1 million), financing activities ($0.0 million) and investing activities (increased $20.4
million), resulting in an increase of $12.3 million in cash and cash equivalents. For the year ended December 31, 2011, the corrections
impact the classification of cash flows from operating activities (decreased $22.4 million), financing activities ($0.0 million) and investing
activities (increased $22.4 million), resulting in no change in cash and cash equivalents. The corrections have an immaterial impact on the
cash flows from operating, investing or financing activities in our Statements of Cash Flows for the years ended December 31, 2012 and
2011. Further, the consolidated Statements of Comprehensive Income (Loss) for the years ended December 31, 2012 and 2011 were only
impacted by the changes in net income (loss) resulting from the corrections.
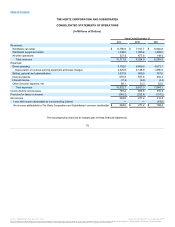
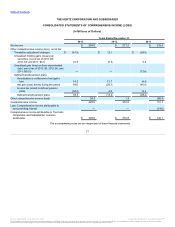
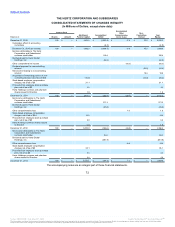
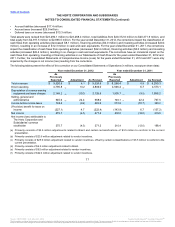
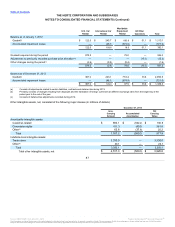
The following tables present the effect of this correction on our Consolidated Statements of Operations (in millions, except per share data):
Total revenues
$9,020.8
$4.1
$9,024.9
$8,298.4
$0.9
$8,299.3
Direct operating
4,795.8 (a) 10.2
4,806.0
4,566.4 (d) 6.7
4,573.1
Depreciation of revenue earning
equipment and lease charges
2,148.2 (b) (19.3)
2,128.9
1,905.7 (e) (9.5)
1,896.2
Selling, general and
administrative
945.6 (c) 22.4
968.0
745.1 (f) 22.4
767.5
Income before income taxes
502.8
(9.2)
493.6
373.9
(18.7)
355.2
(Provision) benefit for taxes on
income
(227.1)
4.7
(222.4)
(143.9)
6.7
(137.2)
Net income
275.7
(4.5)
271.2
230.0
(12.0)
218.0
Net income (loss) attributable to
The Hertz Corporation and
Subsidiaries' common
stockholder
275.7
(4.5)
271.2
210.4
(12.0)
198.4
(a) Primarily consists of $3.6 million adjustments related to Brazil and certain reclassifications of $3.5 million to conform to the current
presentation.
(b) Primarily consists of $23.6 million adjustment related to vendor incentives.
(c) Primarily consists of $25.9 million adjustment related to vendor incentives, offset by certain reclassifications of $3.5 million to conform to the
current presentation.
(d) Primarily consists of $6.2 million adjustment related to Brazil.
(e) Primarily consists of $9.5 million adjustment related to vendor incentives.
(f) Primarily consists of $22.4 million adjustment related to vendor incentives.
77
Source: HERTZ CORP, 10-K, March 31, 2014 Powered by Morningstar® Document Research℠
The information contained herein may not be copied, adapted or distributed and is not warranted to be accurate, complete or timely. The user assumes all risks for any damages or losses arising from any use of this information,
except to the extent such damages or losses cannot be limited or excluded by applicable law. Past financial performance is no guarantee of future results.