Hertz 2013 Annual Report Download - page 52
Download and view the complete annual report
Please find page 52 of the 2013 Hertz annual report below. You can navigate through the pages in the report by either clicking on the pages listed below, or by using the keyword search tool below to find specific information within the annual report.-
 1
1 -
2
-
3
-
4
-
5
-
6
-
7
-
8
-
9
-
10
-
11
-
12
-
13
-
14
-
15
-
16
-
17
-
18
-
19
-
20
-
21
-
22
-
23
-
24
-
25
-
26
-
27
-
28
-
29
-
30
-
31
-
32
-
33
-
34
-
35
-
36
-
37
-
38
-
39
-
40
-
41
-
 42
42 -
 43
43 -
 44
44 -
 45
45 -
 46
46 -
 47
47 -
 48
48 -
 49
49 -
 50
50 -
 51
51 -
 52
52 -
 53
53 -
 54
54 -
 55
55 -
 56
56 -
 57
57 -
 58
58 -
 59
59 -
 60
60 -
 61
61 -
 62
62 -
63
-
64
-
65
-
66
-
67
-
68
-
69
-
70
-
71
-
72
-
73
-
74
-
75
-
76
-
77
-
78
-
79
-
80
-
81
-
82
-
83
-
84
-
85
-
86
-
87
-
88
-
89
-
90
-
91
-
92
-
93
-
94
-
95
-
96
-
97
-
98
-
99
-
100
-
101
-
102
-
103
-
104
-
105
-
106
-
107
-
108
-
109
-
110
-
111
-
112
-
113
-
114
-
115
-
116
-
117
-
118
-
119
-
120
-
121
-
122
-
123
-
124
-
125
-
126
-
127
-
128
-
129
-
130
-
131
-
132
-
133
-
134
-
135
-
136
-
137
-
138
-
139
-
140
-
141
-
142
-
143
-
144
-
145
-
146
-
147
-
148
-
149
-
150
-
151
-
152
-
153
-
154
-
155
-
156
-
157
-
158
-
159
-
160
-
161
-
162
-
163
-
164
-
165
-
166
-
167
-
168
-
169
-
170
-
171
-
172
-
173
-
174
-
175
-
176
-
177
-
178
-
179
-
180
-
181
-
182
-
183
-
184
-
185
-
186
-
187
-
188
-
189
-
190
-
191
 |
 |

Table of Contents
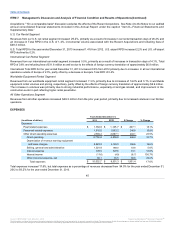
Other (Income) Expense, Net
Other (income) expense, net of $104.7 million for 2013 increased $69.2 million, or 194.9% from $35.5 million for 2012. Primarily included
within 2013 other (income) expense, net is the impairment charges and other of $44.0 million, debt extinguishment loss and inducement
costs related to the early conversion of a portion of our Convertible Senior Notes of $38.6 million and premiums paid and write-offs relating to
the European debt of $28.7 million, partly offset by a $5.8 million adjustment to Advantage divestiture support payments. Primarily included
within 2012 other (income) expense, net is a loss on the Advantage divestiture of $31.4 million, expenses related to additional required
divestitures and costs associated with the Dollar Thrifty acquisition of $24.2 million, partly offset by a gain from the sale of Switzerland
operations of $10.3 million and a gain on the investment in Dollar Thrifty stock of $8.5 million.
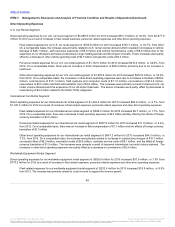
ADJUSTED PRE-TAX INCOME (LOSS)
U.S. Car Rental Segment
Adjusted pre-tax income for our U.S. car rental segment of $1,091.1 million increased 25.0% from $872.8 million for 2012. The increase
was primarily due to stronger volumes, pricing, disciplined cost management and synergies achieved from the Dollar Thrifty integration.
Adjustments to our U.S. car rental segment income before income taxes for 2013 totaled $158.5 million (which consists of integration
expenses of $18.1 million, purchase accounting charges of $65.2 million, debt-related charges of $14.0 million, restructuring and
restructuring related charges of $25.6 million, impairment and other of $44.0 million and loss on derivatives of $0.2 million, partly offset by
other income of $8.6 million). Adjustments to our U.S. car rental segment income before income taxes for 2012 totaled $165.8 million
(which consists of acquisition related costs and charges of $96.4 million, purchase accounting charges of $34.3 million, debt-related charges
of $19.2 million, restructuring and restructuring related charges of $10.9 million and other of $5.0 million). See footnote (c) to the table under
“Results of Operations” for a summary and description of these adjustments.
International Car Rental Segment
Adjusted pre-tax income for our international car rental segment of $141.2 million increased 52.0% from $92.9 million for 2012. The
increase was primarily due to stronger volumes and pricing, lower net depreciation per vehicle, lower interest expense due to favorable
refinancing activity and disciplined cost management. Adjustments to our international car rental segment income before income taxes for
2013 totaled $99.4 million (which consists of debt-related charges of $14.0 million, restructuring and restructuring related charges of
$35.2 million, purchase accounting charges of $9.7 million, $28.7 million in premiums paid on debt, a loss on derivatives of $0.3 million
and other of $11.5 million). Adjustments to our international car rental segment income before income taxes for 2012 totaled $47.6 million
(which consists of restructuring and restructuring related charges of $23.5 million, debt-related charges of $15.1 million, purchase accounting
charges of $8.6 million and loss on derivatives of $0.4 million). See footnote (c) to the table under “Results of Operations” for a summary and
description of these adjustments.
Worldwide Equipment Rental Segment
Adjusted pre-tax income for our worldwide equipment rental segment of $292.1 million increased 29.1% from $226.2 million for 2012. The
increase was primarily due to stronger volumes and pricing and strong cost management performance. Adjustments to our equipment rental
segment income before income taxes for 2013 totaled $58.8 million (which consists of purchase accounting of $40.2 million, restructuring
and restructuring related charges of $10.1 million, debt-related charges of $4.6 million and other of $3.9 million). Adjustments to our
equipment rental segment income before income taxes for 2012 totaled $74.4 million (which consists of purchase accounting of
$44.3 million, other of $15.8 million, restructuring and restructuring related charges of $9.3 million and debt-related charges of $5.0 million).
See footnote (c) to the table under “Results of Operations” for a summary and description of these adjustments.
All Other Operations Segment
Adjusted pre-tax income for our all other operations segment of $57.3 million increased 20.4% from $47.6 million for 2012. The increase
was primarily due to stronger volumes, lower interest expense due to favorable refinancing activity and disciplined cost management.
Adjustments to our all other operations segment income before income taxes for 2013 totaled $21.5 million (which consists of purchase
accounting charges of $15.1 million, debt-related charges of $5.7 million and a loss in other of $0.7 million). Adjustments to our all other
segment income before income taxes for
49
Source: HERTZ CORP, 10-K, March 31, 2014 Powered by Morningstar® Document Research℠
The information contained herein may not be copied, adapted or distributed and is not warranted to be accurate, complete or timely. The user assumes all risks for any damages or losses arising from any use of this information,
except to the extent such damages or losses cannot be limited or excluded by applicable law. Past financial performance is no guarantee of future results.