Hertz 2013 Annual Report Download - page 38
Download and view the complete annual report
Please find page 38 of the 2013 Hertz annual report below. You can navigate through the pages in the report by either clicking on the pages listed below, or by using the keyword search tool below to find specific information within the annual report.-
 1
1 -
2
-
3
-
4
-
5
-
6
-
7
-
8
-
9
-
10
-
11
-
12
-
13
-
14
-
15
-
16
-
17
-
18
-
19
-
20
-
21
-
22
-
23
-
24
-
25
-
26
-
27
-
 28
28 -
 29
29 -
 30
30 -
 31
31 -
 32
32 -
 33
33 -
 34
34 -
 35
35 -
 36
36 -
 37
37 -
 38
38 -
 39
39 -
 40
40 -
 41
41 -
 42
42 -
 43
43 -
 44
44 -
 45
45 -
 46
46 -
 47
47 -
 48
48 -
49
-
50
-
51
-
52
-
53
-
54
-
55
-
56
-
57
-
58
-
59
-
60
-
61
-
62
-
63
-
64
-
65
-
66
-
67
-
68
-
69
-
70
-
71
-
72
-
73
-
74
-
75
-
76
-
77
-
78
-
79
-
80
-
81
-
82
-
83
-
84
-
85
-
86
-
87
-
88
-
89
-
90
-
91
-
92
-
93
-
94
-
95
-
96
-
97
-
98
-
99
-
100
-
101
-
102
-
103
-
104
-
105
-
106
-
107
-
108
-
109
-
110
-
111
-
112
-
113
-
114
-
115
-
116
-
117
-
118
-
119
-
120
-
121
-
122
-
123
-
124
-
125
-
126
-
127
-
128
-
129
-
130
-
131
-
132
-
133
-
134
-
135
-
136
-
137
-
138
-
139
-
140
-
141
-
142
-
143
-
144
-
145
-
146
-
147
-
148
-
149
-
150
-
151
-
152
-
153
-
154
-
155
-
156
-
157
-
158
-
159
-
160
-
161
-
162
-
163
-
164
-
165
-
166
-
167
-
168
-
169
-
170
-
171
-
172
-
173
-
174
-
175
-
176
-
177
-
178
-
179
-
180
-
181
-
182
-
183
-
184
-
185
-
186
-
187
-
188
-
189
-
190
-
191
 |
 |

Table of Contents
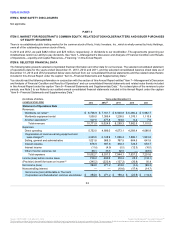
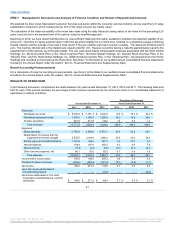
rental of cars, crossovers and light trucks in the United States, or "U.S. car rental,” rental of cars, crossovers and light trucks internationally,
or “international car rental," rental of industrial, construction, material handling and other equipment, or "worldwide equipment rental" and
"all other operations," which includes our Donlen operating segment.
We historically aggregated our U.S., Europe, Other International and Donlen car rental operating segments together to produce a worldwide
car rental reportable segment. We now present our operations as four reportable segments (U.S. car rental, international car rental,
worldwide equipment rental and all other operations). We have revised our segment results presented herein to reflect this new segment
structure, including for prior periods.
U.S. Car Rental
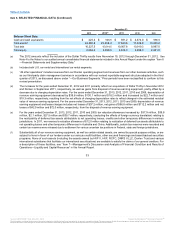
In recent periods we have decreased the percentage of program cars in our car rental fleet, but this strategy remains flexible as we continue to
periodically review the efficiencies of an optimal mix between program and non-program cars in our fleet. However, non-program cars allow
us the opportunity for ancillary revenue, such as warranty and financing, during disposition. Program cars generally provide us with
flexibility to reduce the size of our fleet by returning cars sooner than originally expected without risk of loss in the event of an economic
downturn or to respond to changes in rental demand. This flexibility is reduced as the percentage of non-program cars in our car rental fleet
increases. Furthermore, it is expected that the average age of our fleet will increase since the average holding period for non-program vehicles
is longer than program vehicles. However, the longer holding period does not necessarily equate to higher costs due to the stringent turnback
requirements imposed by vehicle manufacturers for program cars.
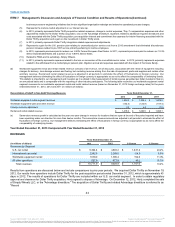
Percentage of non-program cars in our U.S. car rental operations 91%
95%
83%
In the year ended December 31, 2013, our U.S. monthly per vehicle depreciation costs decreased as compared to the prior year period due to
mix optimization, improved procurement and remarketing efforts, optimization of fleet holding periods related to the integration of Dollar
Thrifty and channel diversification.
Depreciation rates are reviewed on a quarterly basis based on management's routine review of present and estimated future market
conditions and their effect on residual values at the time of disposal. During 2013, 2012 and 2011, depreciation rates being used to compute
the provision for depreciation of revenue earning equipment were adjusted on certain vehicles in our car rental operations to reflect changes
in the estimated residual values to be realized when revenue earning equipment is sold. These depreciation rate changes in our U.S. car
rental operations from previous quarters resulted in net decreases of $44.2 million, $139.4 million and $26.7 million in depreciation
expense for the years ended December 31, 2013, 2012 and 2011, respectively. The favorable adjustments reflect changes from the impact of
car sales channel diversification, acceleration of our retail sales expansion and the optimization of fleet holding periods related to the
integration of Dollar Thrifty. The cumulative effect of the reduction in rates was also indicative of the residual values experienced in the U.S.
for the years ended December 31, 2013, 2012 and 2011.
For the years ended December 31, 2013, 2012 and 2011, our U.S. car rental operations sold approximately 197,700, 136,400 and 121,800
non-program cars, respectively, an 44.9% increase in 2013 versus 2012. This increase was primarily related to our recent acquisition of
Dollar Thrifty.
Total revenue per transaction day, or "Total RPD," is calculated as total revenues less revenues from fleet subleases, divided by the total
number of transaction days, with all periods adjusted to eliminate the effect of fluctuations in foreign currency. For the year ended December
31, 2013, we experienced a 26.2% increase in transaction days and a 1.4% increase in Total RPD as compared with the same period in the
prior year in the United States.
Revenues from our U.S. off-airport operations represented $1,453.3 million, $1,306.6 million and $1,198.6 million of our total car rental
revenues in the years ended December 31, 2013, 2012 and 2011, respectively. As of December 31, 2013, we have 2,785 off-airport locations
in the U.S. Our strategy includes selected openings of new off-airport locations, the disciplined evaluation of existing locations and the pursuit
of same-store sales growth. Our strategy also includes increasing penetration in the off-airport market and growing the online leisure market,
particularly in the longer length weekly sector, which is characterized by lower vehicle costs and lower transaction costs at a lower Total RPD.
Increasing our penetration in these sectors is consistent with our long-term strategy to generate profitable growth. When we open a new off-
airport location, we incur a number of costs, including those relating to site selection, lease negotiation, recruitment of employees, selection
and development of managers, initial sales activities and integration
35
Source: HERTZ CORP, 10-K, March 31, 2014 Powered by Morningstar® Document Research℠
The information contained herein may not be copied, adapted or distributed and is not warranted to be accurate, complete or timely. The user assumes all risks for any damages or losses arising from any use of this information,
except to the extent such damages or losses cannot be limited or excluded by applicable law. Past financial performance is no guarantee of future results.