Hertz 2013 Annual Report Download - page 157
Download and view the complete annual report
Please find page 157 of the 2013 Hertz annual report below. You can navigate through the pages in the report by either clicking on the pages listed below, or by using the keyword search tool below to find specific information within the annual report.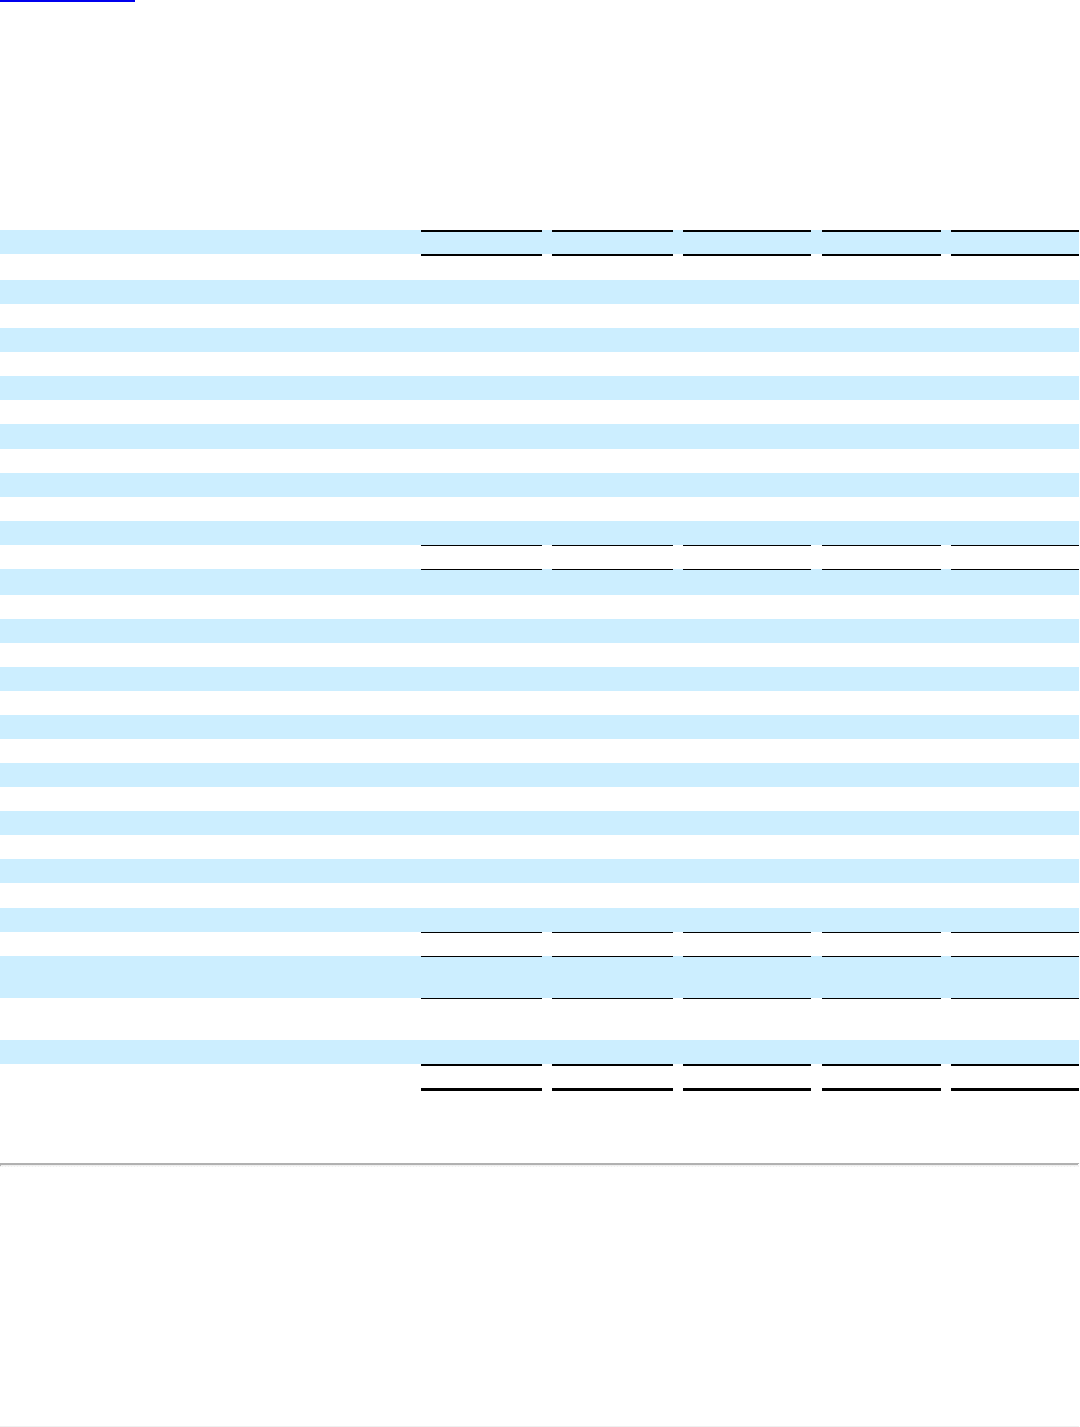
Table of Contents
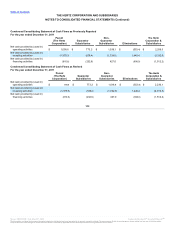
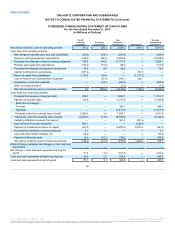
Net cash provided by (used in) operating activities $999.9
$773.2
$1,016.4
$(553.4)
$2,236.1
Cash flows from investing activities:
Net change in restricted cash and cash equivalents (28.6)
(2.7)
(70.4)
—
(101.7)
Revenue earning equipment expenditures (141.4)
(670.1)
(8,620.4)
—
(9,431.9)
Proceeds from disposal of revenue earning equipment 163.3
170.5
7,516.6
—
7,850.4
Property and equipment expenditures (189.5)
(29.7)
(62.5)
—
(281.7)
Proceeds from disposal of property and equipment 24.0
9.3
20.5
—
53.8
Capital contributions to subsidiaries (3,549.1)
—
—
3,549.1
—
Return of capital from subsidiaries 2,590.0
—
—
(2,590.0)
—
Loan to Parent from Non-Guarantor —
—
(490.3)
490.3
—
Acquisitions, net of cash acquired (214.4)
(2.1)
(10.6)
—
(227.1)
Purchase of short-term investments, net (32.9)
—
—
—
(32.9)
Other investing activities —
(13.6)
14.2
—
0.6
Net cash provided by (used in) investing activities (1,378.6)
(538.4)
(1,702.9)
1,449.4
(2,170.5)
Cash flows from financing activities:
Proceeds from issuance of long-term debt 2,455.3
—
607.2
—
3,062.5
Payment of long-term debt (3,596.3)
—
(53.0)
—
(3,649.3)
Short-term borrowings:
—
Proceeds —
—
460.9
—
460.9
Payments (29.2)
—
(1,164.9)
—
(1,194.1)
Proceeds under the revolving lines of credit 1,102.7
1.4
4,002.7
—
5,106.8
Payments under the revolving lines of credit (1,131.9)
(231.2)
(3,801.0)
—
(5,164.1)
Distributions to noncontrolling interest —
—
(23.1)
—
(23.1)
Capital contributions received from parent —
—
3,549.1
(3,549.1)
—
Payment of dividends and return of capital (22.9)
—
(3,143.4)
3,143.4
(22.9)
Proceeds from employee stock purchase plan 3.6
—
—
—
3.6
Loan from Hertz Global Holdings, Inc. (1.0)
—
—
—
(1.0)
Loan to Parent from Non-Guarantor 490.3
—
—
(490.3)
—
Payment of financing costs (81.2)
(2.8)
(7.5)
—
(91.5)
Net cash provided by (used in) financing activities (810.6)
(232.6)
427.0
(896.0)
(1,512.2)
Effect of foreign exchange rate changes on cash and
cash equivalents —
—
3.8
—
3.8
Net change in cash and cash equivalents during the
period (1,189.3)
2.2
(255.7)
—
(1,442.8)
Cash and cash equivalents at beginning of period 1,754.4
5.2
614.4
—
2,374.0
Cash and cash equivalents at end of period $ 565.1
$7.4
$ 358.7
$—
$931.2
153
Source: HERTZ CORP, 10-K, March 31, 2014 Powered by Morningstar® Document Research℠
The information contained herein may not be copied, adapted or distributed and is not warranted to be accurate, complete or timely. The user assumes all risks for any damages or losses arising from any use of this information,
except to the extent such damages or losses cannot be limited or excluded by applicable law. Past financial performance is no guarantee of future results.


