Hertz 2013 Annual Report Download - page 48
Download and view the complete annual report
Please find page 48 of the 2013 Hertz annual report below. You can navigate through the pages in the report by either clicking on the pages listed below, or by using the keyword search tool below to find specific information within the annual report.-
 1
1 -
2
-
3
-
4
-
5
-
6
-
7
-
8
-
9
-
10
-
11
-
12
-
13
-
14
-
15
-
16
-
17
-
18
-
19
-
20
-
21
-
22
-
23
-
24
-
25
-
26
-
27
-
28
-
29
-
30
-
31
-
32
-
33
-
34
-
35
-
36
-
37
-
 38
38 -
 39
39 -
 40
40 -
 41
41 -
 42
42 -
 43
43 -
 44
44 -
 45
45 -
 46
46 -
 47
47 -
 48
48 -
 49
49 -
 50
50 -
 51
51 -
 52
52 -
 53
53 -
 54
54 -
 55
55 -
 56
56 -
 57
57 -
 58
58 -
59
-
60
-
61
-
62
-
63
-
64
-
65
-
66
-
67
-
68
-
69
-
70
-
71
-
72
-
73
-
74
-
75
-
76
-
77
-
78
-
79
-
80
-
81
-
82
-
83
-
84
-
85
-
86
-
87
-
88
-
89
-
90
-
91
-
92
-
93
-
94
-
95
-
96
-
97
-
98
-
99
-
100
-
101
-
102
-
103
-
104
-
105
-
106
-
107
-
108
-
109
-
110
-
111
-
112
-
113
-
114
-
115
-
116
-
117
-
118
-
119
-
120
-
121
-
122
-
123
-
124
-
125
-
126
-
127
-
128
-
129
-
130
-
131
-
132
-
133
-
134
-
135
-
136
-
137
-
138
-
139
-
140
-
141
-
142
-
143
-
144
-
145
-
146
-
147
-
148
-
149
-
150
-
151
-
152
-
153
-
154
-
155
-
156
-
157
-
158
-
159
-
160
-
161
-
162
-
163
-
164
-
165
-
166
-
167
-
168
-
169
-
170
-
171
-
172
-
173
-
174
-
175
-
176
-
177
-
178
-
179
-
180
-
181
-
182
-
183
-
184
-
185
-
186
-
187
-
188
-
189
-
190
-
191
 |
 |

Table of Contents
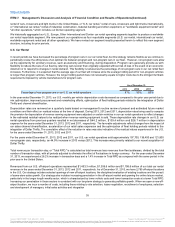
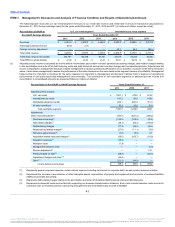
Acquisitions." "On a comparable basis" discussion excludes the effects of the Recent Acquistions. See Note 4 to the Notes to our audited
annual consolidated financial statements included in this Annual Report under the caption “Item 8—Financial Statements and
Supplementary Data.”
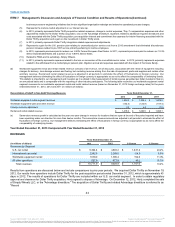
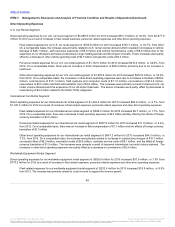
U.S. Car Rental Segment
Revenues from our U.S. car rental segment increased 29.2%, primarily as a result of increases in car rental transaction days of 26.2% and
an increase in Total RPD in the U.S. of 1.4%, incremental volume associated with the Recent Acquisitions and refueling fees of
$49.3 million.
U.S. Total RPD for the year ended December 31, 2013 increased 1.4% from 2012. U.S. airport RPD increased 2.2% and U.S. off-airport
RPD declined by 0.2%.
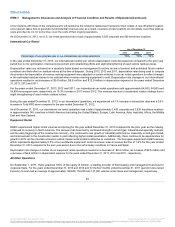
International Car Rental Segment
Revenues from our international car rental segment increased 5.0%, primarily as a result of increases in transaction days of 4.1%, Total
RPD of 0.6% and refueling fees of $11.8 million as well as due to the effects of foreign currency translation of approximately $6.8 million.
International Total RPD for the year ended December 31, 2013 increased 0.6% from 2012 primarily due to increases in all our international
operations outside of Europe of 2.3%, partly offset by a decrease in Europe's Total RPD of 0.4%.
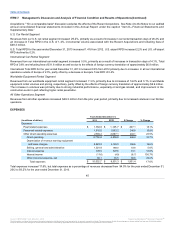
Worldwide Equipment Rental Segment
Revenues from our worldwide equipment rental segment increased 11.0%, primarily due to increases of 14.2% and 3.1% in worldwide
equipment rental volumes and pricing, respectively, partly offset by the effects of foreign currency translation of approximately $6.9 million.
The increase in volumes was primarily due to strong industrial performance, especially oil and gas related, and improvement in the
construction sector in part reflecting higher rental penetration.
All Other Operations Segment
Revenues from all other operations increased $49.2 million from the prior year period, primarily due to increased volumes in our Donlen
operations.
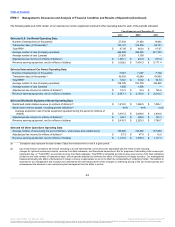
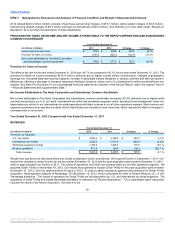
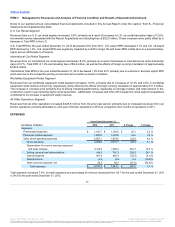
Expenses:
Fleet related expenses $ 1,352.8
$1,145.7
$207.1
18.1%
Personnel related expenses 1,810.0
1,563.2
246.8
15.8%
Other direct operating expenses 2,589.2
2,097.1
492.1
23.5%
Direct operating 5,752.0
4,806.0
946.0
19.7%
Depreciation of revenue earning equipment
and lease charges 2,525.5
2,128.9
396.6
18.6%
Selling, general and administrative 1,021.8
968.0
53.8
5.6%
Interest expense 678.9
597.8
81.1
13.6%
Interest income (11.6)
(4.9)
(6.7)
136.7%
Other (income) expense, net 66.1
35.5
30.6
86.2%
Total expenses $10,032.7
$ 8,531.3
$1,501.4
17.6%
Total expenses increased 17.6%, but total expenses as a percentage of revenues decreased from 94.5% for the year ended December 31,
2012 to 93.2% for the year ended December 31, 2013.
45
Source: HERTZ CORP, 10-K, March 31, 2014 Powered by Morningstar® Document Research℠
The information contained herein may not be copied, adapted or distributed and is not warranted to be accurate, complete or timely. The user assumes all risks for any damages or losses arising from any use of this information,
except to the extent such damages or losses cannot be limited or excluded by applicable law. Past financial performance is no guarantee of future results.