Hertz 2013 Annual Report Download - page 57
Download and view the complete annual report
Please find page 57 of the 2013 Hertz annual report below. You can navigate through the pages in the report by either clicking on the pages listed below, or by using the keyword search tool below to find specific information within the annual report.-
 1
1 -
2
-
3
-
4
-
5
-
6
-
7
-
8
-
9
-
10
-
11
-
12
-
13
-
14
-
15
-
16
-
17
-
18
-
19
-
20
-
21
-
22
-
23
-
24
-
25
-
26
-
27
-
28
-
29
-
30
-
31
-
32
-
33
-
34
-
35
-
36
-
37
-
38
-
39
-
40
-
41
-
42
-
43
-
44
-
45
-
46
-
 47
47 -
 48
48 -
 49
49 -
 50
50 -
 51
51 -
 52
52 -
 53
53 -
 54
54 -
 55
55 -
 56
56 -
 57
57 -
 58
58 -
 59
59 -
 60
60 -
 61
61 -
 62
62 -
 63
63 -
 64
64 -
 65
65 -
 66
66 -
 67
67 -
68
-
69
-
70
-
71
-
72
-
73
-
74
-
75
-
76
-
77
-
78
-
79
-
80
-
81
-
82
-
83
-
84
-
85
-
86
-
87
-
88
-
89
-
90
-
91
-
92
-
93
-
94
-
95
-
96
-
97
-
98
-
99
-
100
-
101
-
102
-
103
-
104
-
105
-
106
-
107
-
108
-
109
-
110
-
111
-
112
-
113
-
114
-
115
-
116
-
117
-
118
-
119
-
120
-
121
-
122
-
123
-
124
-
125
-
126
-
127
-
128
-
129
-
130
-
131
-
132
-
133
-
134
-
135
-
136
-
137
-
138
-
139
-
140
-
141
-
142
-
143
-
144
-
145
-
146
-
147
-
148
-
149
-
150
-
151
-
152
-
153
-
154
-
155
-
156
-
157
-
158
-
159
-
160
-
161
-
162
-
163
-
164
-
165
-
166
-
167
-
168
-
169
-
170
-
171
-
172
-
173
-
174
-
175
-
176
-
177
-
178
-
179
-
180
-
181
-
182
-
183
-
184
-
185
-
186
-
187
-
188
-
189
-
190
-
191
 |
 |

Table of Contents
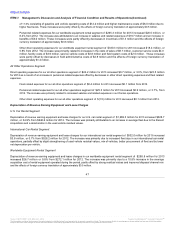
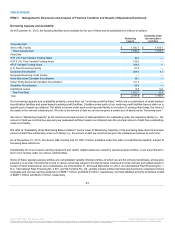
depreciation per vehicle, higher vehicle residual values, a higher mix of non-program cars and the effects of foreign currency translation of
approximately $31.4 million.
Worldwide Equipment Rental Segment
Depreciation of revenue earning equipment and lease charges in our worldwide equipment rental segment of $272.1 million for 2012
increased 7.0% from $254.3 million for 2011. The increase was primarily due to a 9.4% increase in the average acquisition cost of rental
equipment operated during the period, partly offset by higher residual values on the disposal of used equipment and the effects of foreign
currency translation of approximately $2.5 million.
All Other Operations Segment
Depreciation of revenue earning equipment and lease charges in our all other operations segment of $388.0 million for 2012 increased
$271.0 million, or 231.6% from $117.0 million for 2011. The increase was primarily attributable to a full year of Donlen operations in 2012 as
compared to four months of operations in 2011.
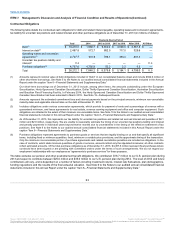
Selling, General and Administrative Expenses
Selling, general and administrative expenses of $968.0 million for 2012 increased $221.3 million due to increases in administrative, sales
promotion and advertising expenses, partly offset by the effects of foreign currency translation of approximately $20.8 million.
Administrative expenses increased $189.4 million, or 38.4%. On a comparable basis, acquisition fees increased $26.0 million,
expenses associated with the withdrawal from a multiemployer pension plan increased $23.2 million, contractor costs increased $5.5
million, legal expenses increased $6.4 million, restructuring and restructuring related charges increased by $8.1 million, which is in
addition to litigation settlement expenses of $19.2 million. These increases were partly offset by the effects of foreign currency translation
of approximately $14.2 million. The remaining 2012 net increase was primarily attributable to the Recent Acquisitions.
Sales promotion expenses increased $12.0 million, or 6.7%, primarily related to increases in sales salaries and commissions due to
improved results, partially offset by the effects of foreign currency translation of approximately $2.4 million.
Advertising expenses increased $19.9 million, or 9.3%, primarily due to increased media and on-line advertising, higher airline miles
expense associated with increased volume, costs related to our customer loyalty program, partly offset by the effects of foreign currency
translation of approximately $4.2 million. The remaining 2012 net increase was primarily attributable to the Recent Acquisitions.
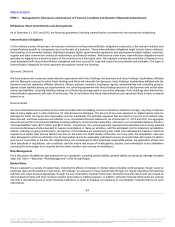
Interest Expense
U.S. Car Rental Segment
Interest expense for our U.S. car rental segment of $176.9 million for 2012 increased 6.5% from $166.1 million for 2011. The increase is
primarily due to higher levels of debt required to fund the Recent Acquisitions. The increase was partly offset by debt refinancing activity and
lower interest rates in 2012.
International Car Rental Segment
Interest expense for our international car rental segment of $124.2 million for 2012 decreased 22.9% from $161.0 million for 2011. The
decrease was primarily due to debt refinancing activity, lower interest rates in 2012 and the effects of foreign currency translation of $8.5
million.
Worldwide Equipment Rental Segment
Interest expense for our worldwide equipment rental segment of $52.0 million for 2012 increased 14.8% from $45.3 million for 2011. The
increase was primarily due to increases in the weighted-average debt outstanding as a result of an increase in average fleet size.
54
Source: HERTZ CORP, 10-K, March 31, 2014 Powered by Morningstar® Document Research℠
The information contained herein may not be copied, adapted or distributed and is not warranted to be accurate, complete or timely. The user assumes all risks for any damages or losses arising from any use of this information,
except to the extent such damages or losses cannot be limited or excluded by applicable law. Past financial performance is no guarantee of future results.