Hertz 2013 Annual Report Download - page 164
Download and view the complete annual report
Please find page 164 of the 2013 Hertz annual report below. You can navigate through the pages in the report by either clicking on the pages listed below, or by using the keyword search tool below to find specific information within the annual report.-
 1
1 -
2
-
3
-
4
-
5
-
6
-
7
-
8
-
9
-
10
-
11
-
12
-
13
-
14
-
15
-
16
-
17
-
18
-
19
-
20
-
21
-
22
-
23
-
24
-
25
-
26
-
27
-
28
-
29
-
30
-
31
-
32
-
33
-
34
-
35
-
36
-
37
-
38
-
39
-
40
-
41
-
42
-
43
-
44
-
45
-
46
-
47
-
48
-
49
-
50
-
51
-
52
-
53
-
54
-
55
-
56
-
57
-
58
-
59
-
60
-
61
-
62
-
63
-
64
-
65
-
66
-
67
-
68
-
69
-
70
-
71
-
72
-
73
-
74
-
75
-
76
-
77
-
78
-
79
-
80
-
81
-
82
-
83
-
84
-
85
-
86
-
87
-
88
-
89
-
90
-
91
-
92
-
93
-
94
-
95
-
96
-
97
-
98
-
99
-
100
-
101
-
102
-
103
-
104
-
105
-
106
-
107
-
108
-
109
-
110
-
111
-
112
-
113
-
114
-
115
-
116
-
117
-
118
-
119
-
120
-
121
-
122
-
123
-
124
-
125
-
126
-
127
-
128
-
129
-
130
-
131
-
132
-
133
-
134
-
135
-
136
-
137
-
138
-
139
-
140
-
141
-
142
-
143
-
144
-
145
-
146
-
147
-
148
-
149
-
150
-
151
-
152
-
153
-
 154
154 -
 155
155 -
 156
156 -
 157
157 -
 158
158 -
 159
159 -
 160
160 -
 161
161 -
 162
162 -
 163
163 -
 164
164 -
 165
165 -
 166
166 -
 167
167 -
 168
168 -
 169
169 -
 170
170 -
 171
171 -
 172
172 -
 173
173 -
 174
174 -
175
-
176
-
177
-
178
-
179
-
180
-
181
-
182
-
183
-
184
-
185
-
186
-
187
-
188
-
189
-
190
-
191
 |
 |
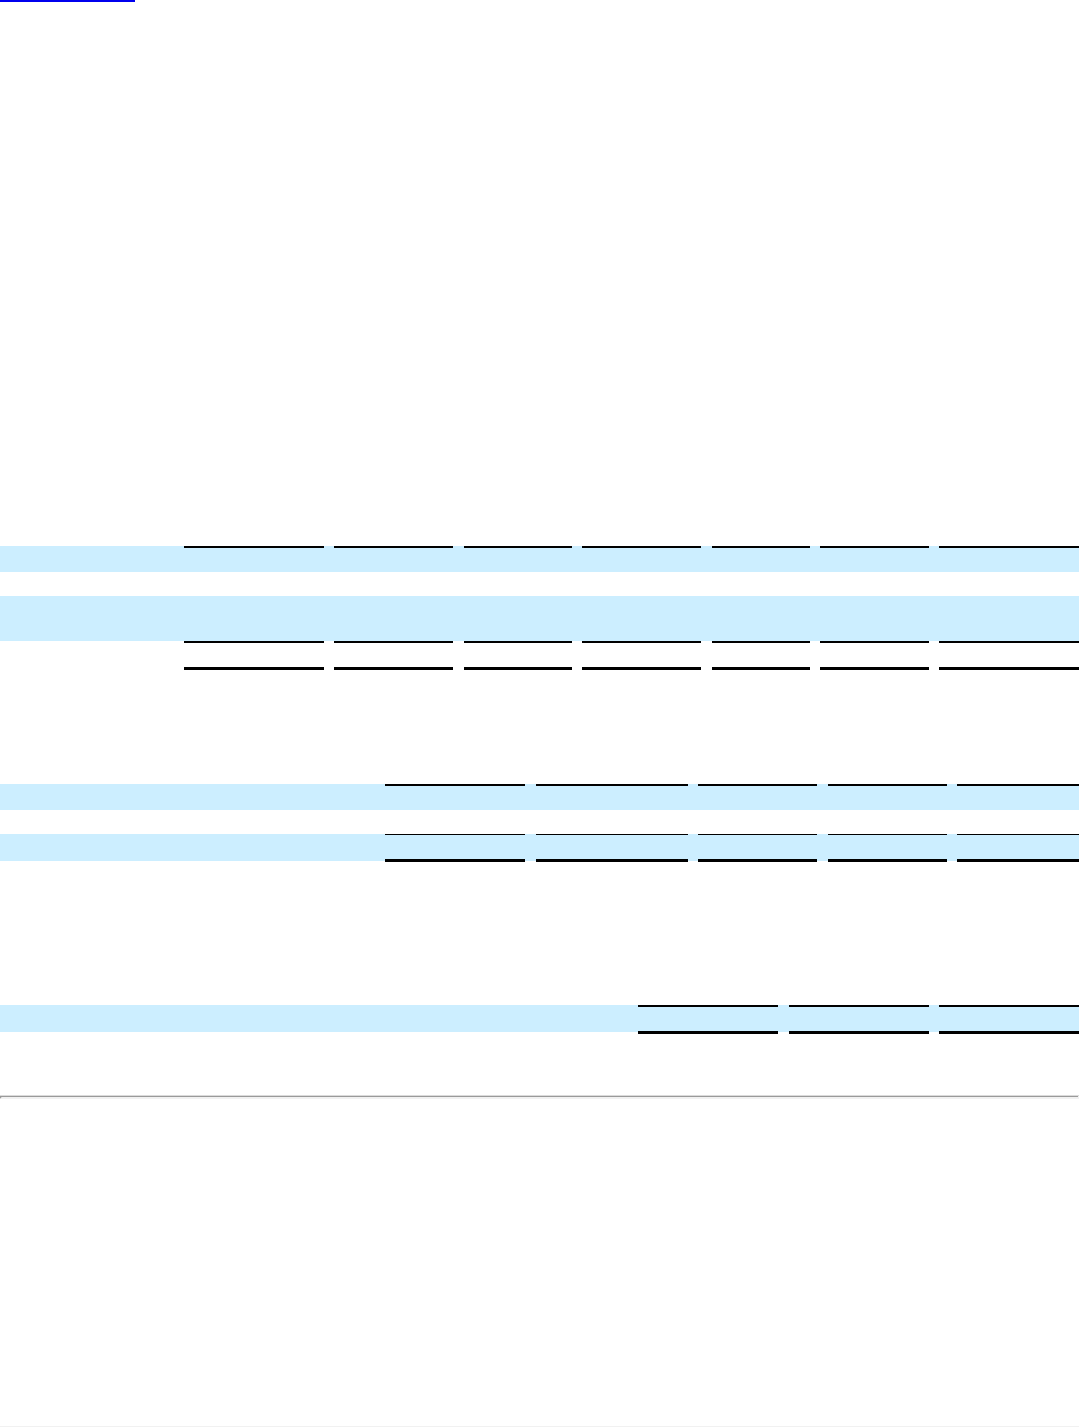
Table of Contents
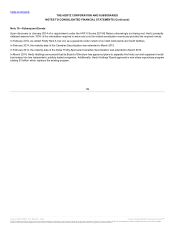
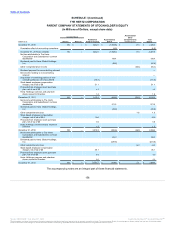
The accompanying condensed financial statements include only the accounts of The Hertz Corporation, or the “Company.” Investments in
the Company's subsidiaries are accounted for under the equity method. These parent company financial statements have been prepared in
accordance with Rule 12-04 of Regulation S-X, as restricted net assets of the Company's subsidiaries exceed 25% of the Company's
consolidated net assets as of December 31, 2013.
Certain information and footnote disclosures normally included in financial statements prepared in accordance with accounting principles
generally accepted in the United States of America have been condensed or omitted since this information is included in the Company's
annual consolidated financial statements included in this Annual Report under the caption “Item 8—Financial Statements and
Supplementary Data.”
During the fourth quarter of 2013, we revised our previously issued consolidated financial statements as more fully described in Note 2
—Summary of Significant Accounting Policies and Note 18—Guarantor and Non-Guarantor Condensed Consolidating Financial Statements
included in this Annual Report under the caption “Item 8—Financial Statements and Supplementary Data.” Management has concluded that
the impact on the Parent Company financial statements as a result of the revision is not material.
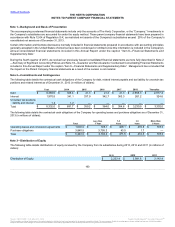
The following table details the contractual cash obligations of the Company for debt, related interest payable and tax liability for uncertain tax
positions and related interest as of December 31, 2013 (in millions of dollars):
Debt $6,360.0
$349.4
$21.3
$21.3
$21.3
$2,969.3
$2,977.4
Interest 1,970.8
341.1
337.9
342.7
363.3
261.2
324.6
Uncertain tax positions
liability and interest 1.2
1.2
—
—
—
—
—
Total $8,332.0
$691.7
$359.2
$364.0
$384.6
$3,230.5
$3,302.0
The following table details the contractual cash obligations of the Company for operating leases and purchase obligations as of December 31,
2013 (in millions of dollars):
Operating leases and concession agreements $1,603.0
$309.1
$428.1
$270.8
$595.0
Purchase obligations 3,840.5
3,795.3
43.5
1.7
—
Total $5,443.5
$4,104.4
$471.6
$272.5
$595.0
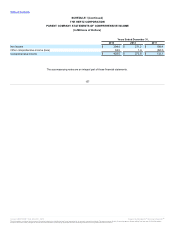
The following table details distributions of equity received by the Company from its subsidiaries during 2013, 2012 and 2011 (in millions of
dollars):
Distribution of Equity $2,233.4
$3,981.6
$3,143.4
160
Source: HERTZ CORP, 10-K, March 31, 2014 Powered by Morningstar® Document Research℠
The information contained herein may not be copied, adapted or distributed and is not warranted to be accurate, complete or timely. The user assumes all risks for any damages or losses arising from any use of this information,
except to the extent such damages or losses cannot be limited or excluded by applicable law. Past financial performance is no guarantee of future results.