Hertz 2013 Annual Report Download - page 109
Download and view the complete annual report
Please find page 109 of the 2013 Hertz annual report below. You can navigate through the pages in the report by either clicking on the pages listed below, or by using the keyword search tool below to find specific information within the annual report.-
 1
1 -
2
-
3
-
4
-
5
-
6
-
7
-
8
-
9
-
10
-
11
-
12
-
13
-
14
-
15
-
16
-
17
-
18
-
19
-
20
-
21
-
22
-
23
-
24
-
25
-
26
-
27
-
28
-
29
-
30
-
31
-
32
-
33
-
34
-
35
-
36
-
37
-
38
-
39
-
40
-
41
-
42
-
43
-
44
-
45
-
46
-
47
-
48
-
49
-
50
-
51
-
52
-
53
-
54
-
55
-
56
-
57
-
58
-
59
-
60
-
61
-
62
-
63
-
64
-
65
-
66
-
67
-
68
-
69
-
70
-
71
-
72
-
73
-
74
-
75
-
76
-
77
-
78
-
79
-
80
-
81
-
82
-
83
-
84
-
85
-
86
-
87
-
88
-
89
-
90
-
91
-
92
-
93
-
94
-
95
-
96
-
97
-
98
-
 99
99 -
 100
100 -
 101
101 -
 102
102 -
 103
103 -
 104
104 -
 105
105 -
 106
106 -
 107
107 -
 108
108 -
 109
109 -
 110
110 -
 111
111 -
 112
112 -
 113
113 -
 114
114 -
 115
115 -
 116
116 -
 117
117 -
 118
118 -
 119
119 -
120
-
121
-
122
-
123
-
124
-
125
-
126
-
127
-
128
-
129
-
130
-
131
-
132
-
133
-
134
-
135
-
136
-
137
-
138
-
139
-
140
-
141
-
142
-
143
-
144
-
145
-
146
-
147
-
148
-
149
-
150
-
151
-
152
-
153
-
154
-
155
-
156
-
157
-
158
-
159
-
160
-
161
-
162
-
163
-
164
-
165
-
166
-
167
-
168
-
169
-
170
-
171
-
172
-
173
-
174
-
175
-
176
-
177
-
178
-
179
-
180
-
181
-
182
-
183
-
184
-
185
-
186
-
187
-
188
-
189
-
190
-
191
 |
 |
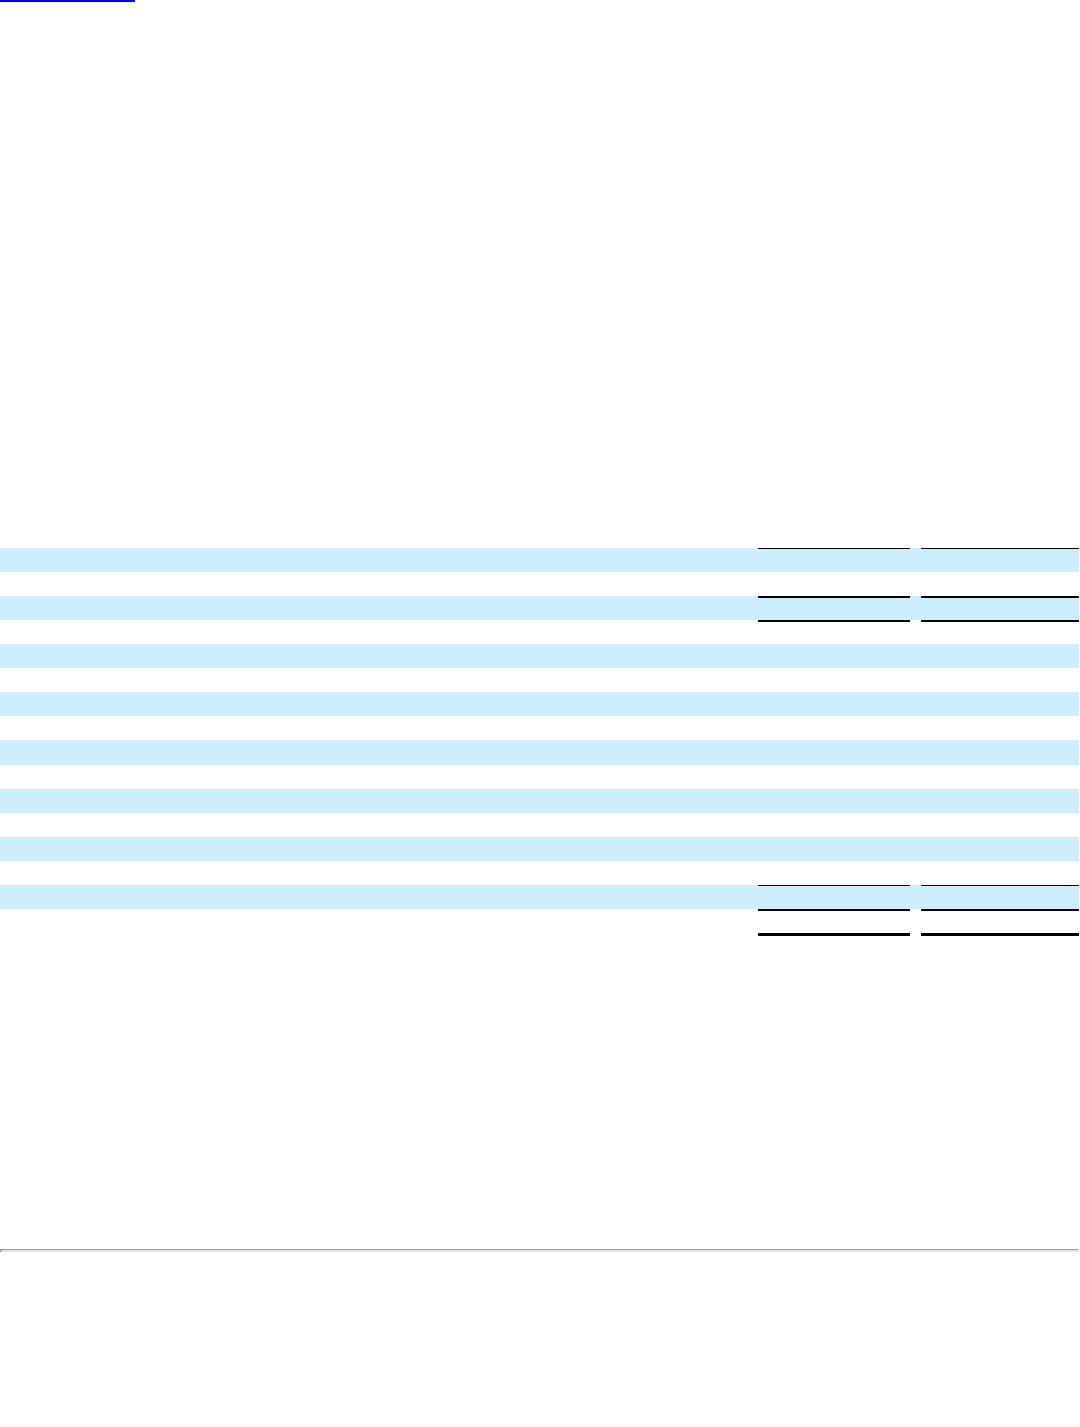
Table of Contents
million (the equivalent of $41.2 million as of December 31, 2013). This seasonal facility was drawn for most of the period and paid down at
the end of October 2013 in line with its maturity date and defleeting activities.
Restricted Net Assets
As a result of the contractual restrictions on Hertz's or its subsidiaries' ability to pay dividends (directly or indirectly) under various terms of
our debt, as of December 31, 2013, the restricted net assets of our subsidiaries exceeded 25% of our total consolidated net assets.
Financial Covenant Compliance
Under the terms of our Senior Term Facility and Senior ABL Facility, we are not subject to ongoing financial maintenance covenants;
however, under the Senior ABL Facility, failure to maintain certain levels of liquidity will subject the Hertz credit group to a contractually
specified fixed charge coverage ratio of not less than 1:1 for the four quarters most recently ended. As of December 31, 2013, we were not
subject to such contractually specified fixed charge coverage ratio.
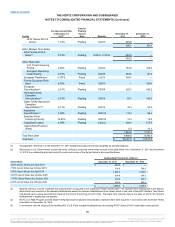
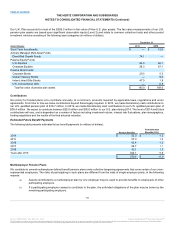
Borrowing Capacity and Availability
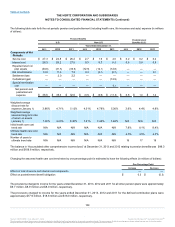
As of December 31, 2013, the following facilities were available for the use of Hertz and its subsidiaries (in millions of dollars):
Corporate Debt
Senior ABL Facility $1,156.7
$1,156.7
Total Corporate Debt 1,156.7
1,156.7
Fleet Debt
HVF U.S. Fleet Variable Funding Notes 90.0
—
HVF II U.S. Fleet Variable Funding Notes 210.0
—
HFLF Variable Funding Notes 104.0
—
U.S. Fleet Financing Facility 37.0
—
European Securitization 269.5
4.1
European Revolving Credit Facility —
—
Hertz-Sponsored Canadian Securitization 98.1
—
Dollar Thrifty-Sponsored Canadian Securitization 101.8
—
Australian Securitization 110.9
—
Capitalized Leases 19.8
19.8
Total Fleet Debt 1,041.1
23.9
Total $ 2,197.8
$ 1,180.6
Our borrowing capacity and availability primarily comes from our "revolving credit facilities," which are a combination of asset-backed
securitization facilities and asset-based revolving credit facilities. Creditors under each of our revolving credit facilities have a claim on a
specific pool of assets as collateral. Our ability to borrow under each revolving credit facility is a function of, among other things, the value of
the assets in the relevant collateral pool. We refer to the amount of debt we can borrow given a certain pool of assets as the "borrowing base."
We refer to "Remaining Capacity" as the maximum principal amount of debt permitted to be outstanding under the respective facility (i.e., the
amount of debt we could borrow assuming we possessed sufficient assets as collateral) less the principal amount of debt then-outstanding
under such facility.
We refer to "Availability Under Borrowing Base Limitation" as the lower of Remaining Capacity or the borrowing base less the principal
amount of debt then-outstanding under such facility (i.e., the amount of debt we could borrow given the collateral we possess at such time).
105
Source: HERTZ CORP, 10-K, March 31, 2014 Powered by Morningstar® Document Research℠
The information contained herein may not be copied, adapted or distributed and is not warranted to be accurate, complete or timely. The user assumes all risks for any damages or losses arising from any use of this information,
except to the extent such damages or losses cannot be limited or excluded by applicable law. Past financial performance is no guarantee of future results.