Hertz 2013 Annual Report Download - page 37
Download and view the complete annual report
Please find page 37 of the 2013 Hertz annual report below. You can navigate through the pages in the report by either clicking on the pages listed below, or by using the keyword search tool below to find specific information within the annual report.-
 1
1 -
2
-
3
-
4
-
5
-
6
-
7
-
8
-
9
-
10
-
11
-
12
-
13
-
14
-
15
-
16
-
17
-
18
-
19
-
20
-
21
-
22
-
23
-
24
-
25
-
26
-
 27
27 -
 28
28 -
 29
29 -
 30
30 -
 31
31 -
 32
32 -
 33
33 -
 34
34 -
 35
35 -
 36
36 -
 37
37 -
 38
38 -
 39
39 -
 40
40 -
 41
41 -
 42
42 -
 43
43 -
 44
44 -
 45
45 -
 46
46 -
 47
47 -
48
-
49
-
50
-
51
-
52
-
53
-
54
-
55
-
56
-
57
-
58
-
59
-
60
-
61
-
62
-
63
-
64
-
65
-
66
-
67
-
68
-
69
-
70
-
71
-
72
-
73
-
74
-
75
-
76
-
77
-
78
-
79
-
80
-
81
-
82
-
83
-
84
-
85
-
86
-
87
-
88
-
89
-
90
-
91
-
92
-
93
-
94
-
95
-
96
-
97
-
98
-
99
-
100
-
101
-
102
-
103
-
104
-
105
-
106
-
107
-
108
-
109
-
110
-
111
-
112
-
113
-
114
-
115
-
116
-
117
-
118
-
119
-
120
-
121
-
122
-
123
-
124
-
125
-
126
-
127
-
128
-
129
-
130
-
131
-
132
-
133
-
134
-
135
-
136
-
137
-
138
-
139
-
140
-
141
-
142
-
143
-
144
-
145
-
146
-
147
-
148
-
149
-
150
-
151
-
152
-
153
-
154
-
155
-
156
-
157
-
158
-
159
-
160
-
161
-
162
-
163
-
164
-
165
-
166
-
167
-
168
-
169
-
170
-
171
-
172
-
173
-
174
-
175
-
176
-
177
-
178
-
179
-
180
-
181
-
182
-
183
-
184
-
185
-
186
-
187
-
188
-
189
-
190
-
191
 |
 |

Table of Contents
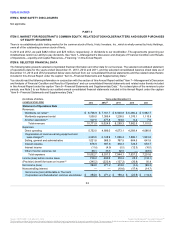
The statements in this discussion and analysis regarding industry outlook, our expectations regarding the performance of our
business and the other non-historical statements are forward-looking statements. These forward-looking statements are subject to
numerous risks and uncertainties, including, but not limited to, the risks and uncertainties described in “Item 1A —Risk Factors.” The
following discussion and analysis provides information that we believe to be relevant to an understanding of our consolidated
financial condition and results of operations. Our actual results may differ materially from those contained in or implied by any
forward-looking statements. You should read the following discussion and analysis together with the sections entitled “Cautionary
Note Regarding Forward-Looking Statements,” “Item 1A —Risk Factors,” “Item 6—Selected Financial Data” and our consolidated
financial statements and related notes included in this Annual Report under the caption “Item 8 —Financial Statements and
Supplementary Data.”
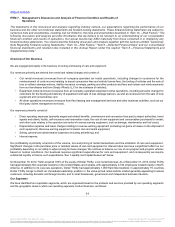
Overview of Our Business
We are engaged principally in the business of renting and leasing of cars and equipment.
Our revenues primarily are derived from rental and related charges and consist of:
•Car rental revenues (revenues from all company-operated car rental operations, including charges to customers for the
reimbursement of costs incurred relating to airport concession fees and vehicle license fees, the fueling of vehicles and the sale of
loss or collision damage waivers, liability insurance coverage, parking and other products and fees and certain cost reimbursements
from our franchisees and from Simply Wheelz LLC for the sublease of vehicles);
•Equipment rental revenues (revenues from all company-operated equipment rental operations, including amounts charged to
customers for the fueling and delivery of equipment and sale of loss damage waivers, as well as revenues from the sale of new
equipment and consumables); and
•All other operations revenues (revenues from fleet leasing and management services and other business activities, such as our
third party claims management services).
Our expenses primarily consist of:
•Direct operating expenses (primarily wages and related benefits; commissions and concession fees paid to airport authorities, travel
agents and others; facility, self-insurance and reservation costs; the cost of new equipment and consumables purchased for resale;
and other costs relating to the operation and rental of revenue earning equipment, such as damage, maintenance and fuel costs);
•Depreciation expense and lease charges relating to revenue earning equipment (including net gains or losses on the disposal of
such equipment). Revenue earning equipment includes cars and rental equipment;
•Selling, general and administrative expenses (including advertising); and
•Interest expense.
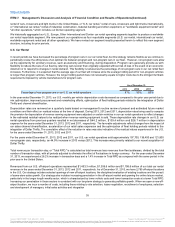
Our profitability is primarily a function of the volume, mix and pricing of rental transactions and the utilization of cars and equipment.
Significant changes in the purchase price or residual values of cars and equipment or interest rates can have a significant effect on our
profitability depending on our ability to adjust pricing for these changes. We continue to balance our mix of non-program and program vehicles
based on market conditions. Our business requires significant expenditures for cars and equipment, and consequently we require
substantial liquidity to finance such expenditures. See "Liquidity and Capital Resources" below.
On November 19, 2012, Hertz acquired 100% of the equity of Dollar Thrifty, a car rental business. As of December 31, 2013, Dollar Thrifty
had approximately 340 corporate locations in the United States and Canada, with approximately 4,100 employees located mainly in North
America. In addition to its corporate operations, Dollar Thrifty had approximately 1,060 franchise locations in approximately 75 countries.
Dollar Thrifty brings to Hertz an immediate leadership position in the value-priced rental vehicle market generally appealing to leisure
customers, including domestic and foreign tourists, and to small businesses, government and independent business travelers.
Our Segments
We have identified four reportable segments, which are organized based on the products and services provided by our operating segments
and the geographic areas in which our operating segments conduct business, as follows:
34
Source: HERTZ CORP, 10-K, March 31, 2014 Powered by Morningstar® Document Research℠
The information contained herein may not be copied, adapted or distributed and is not warranted to be accurate, complete or timely. The user assumes all risks for any damages or losses arising from any use of this information,
except to the extent such damages or losses cannot be limited or excluded by applicable law. Past financial performance is no guarantee of future results.