Hertz 2013 Annual Report Download - page 114
Download and view the complete annual report
Please find page 114 of the 2013 Hertz annual report below. You can navigate through the pages in the report by either clicking on the pages listed below, or by using the keyword search tool below to find specific information within the annual report.-
 1
1 -
2
-
3
-
4
-
5
-
6
-
7
-
8
-
9
-
10
-
11
-
12
-
13
-
14
-
15
-
16
-
17
-
18
-
19
-
20
-
21
-
22
-
23
-
24
-
25
-
26
-
27
-
28
-
29
-
30
-
31
-
32
-
33
-
34
-
35
-
36
-
37
-
38
-
39
-
40
-
41
-
42
-
43
-
44
-
45
-
46
-
47
-
48
-
49
-
50
-
51
-
52
-
53
-
54
-
55
-
56
-
57
-
58
-
59
-
60
-
61
-
62
-
63
-
64
-
65
-
66
-
67
-
68
-
69
-
70
-
71
-
72
-
73
-
74
-
75
-
76
-
77
-
78
-
79
-
80
-
81
-
82
-
83
-
84
-
85
-
86
-
87
-
88
-
89
-
90
-
91
-
92
-
93
-
94
-
95
-
96
-
97
-
98
-
99
-
100
-
101
-
102
-
103
-
 104
104 -
 105
105 -
 106
106 -
 107
107 -
 108
108 -
 109
109 -
 110
110 -
 111
111 -
 112
112 -
 113
113 -
 114
114 -
 115
115 -
 116
116 -
 117
117 -
 118
118 -
 119
119 -
 120
120 -
 121
121 -
 122
122 -
 123
123 -
 124
124 -
125
-
126
-
127
-
128
-
129
-
130
-
131
-
132
-
133
-
134
-
135
-
136
-
137
-
138
-
139
-
140
-
141
-
142
-
143
-
144
-
145
-
146
-
147
-
148
-
149
-
150
-
151
-
152
-
153
-
154
-
155
-
156
-
157
-
158
-
159
-
160
-
161
-
162
-
163
-
164
-
165
-
166
-
167
-
168
-
169
-
170
-
171
-
172
-
173
-
174
-
175
-
176
-
177
-
178
-
179
-
180
-
181
-
182
-
183
-
184
-
185
-
186
-
187
-
188
-
189
-
190
-
191
 |
 |

Table of Contents
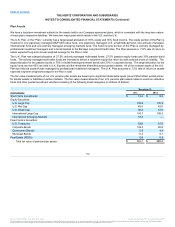
Plan Assets
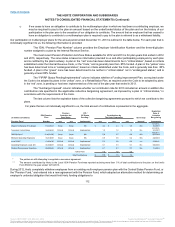
We have a long-term investment outlook for the assets held in our Company sponsored plans, which is consistent with the long-term nature
of each plan's respective liabilities. We have two major plans which reside in the U.S. and the U.K.
The U.S. Plan, or the “Plan,” currently has a target asset allocation of 65% equity and 35% fixed income. The equity portion of the Plan is
invested in one passively managed S&P 500 index fund, one passively managed U.S. small/midcap fund, one actively managed
international fund and one actively managed emerging markets fund. The fixed income portion of the Plan is actively managed by
professional investment managers and is benchmarked to the Barclays Long Govt/Credit Index. The Plan assumes a 7.6% rate of return on
assets expected long-term annual weighted-average for the Plan in total.
The U.K. Plan has a target allocation of 37.5% actively managed multi-asset funds, 27.5% passive equity funds and 35% passive bond
funds. The actively managed multi-asset funds are intended to deliver a long-term equity-like return but with reduced levels of volatility. The
target allocation for the passive bonds is 70% in index-linked government bonds and 30% in corporate bonds. The target allocation for the
equity funds are that 45% are held in U.K. Equities and the remainder diversified across global markets. All of the invested assets of the U.K.
Plan are held via pooled funds managed by professional investment managers. The U.K. Plan assumes a 7.5% rate of return on assets
expected long-term weighted-average for the Plan in total.
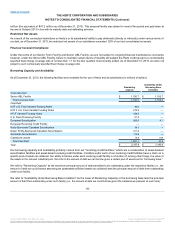
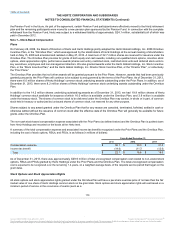
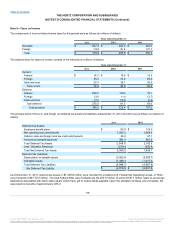
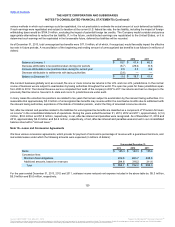
The fair value measurements of our U.S. pension plan assets are based upon significant observable inputs (Level 2)that reflect quoted prices
for similar assets or liabilities in active markets. The fair value measurements of our U.S. pension plan assets relate to common collective
trusts and other pooled investment vehicles consisting of the following asset categories (in millions of dollars):
Short Term Investments $13.4
$8.3
Equity Securities:
U.S. Large Cap 159.6
135.9
U.S. Mid Cap 45.4
42.0
U.S. Small Cap 36.2
31.6
International Large Cap 100.7
109.3
International Emerging Markets 18.3
—
Fixed Income Securities:
U.S. Treasuries 59.8
67.5
Corporate Bonds 106.0
83.8
Government Bonds 5.9
4.4
Municipal Bonds 11.4
9.1
Real Estate (REITs) 6.4
6.5
Total fair value of pension plan assets $563.1
$498.4
110
Source: HERTZ CORP, 10-K, March 31, 2014 Powered by Morningstar® Document Research℠
The information contained herein may not be copied, adapted or distributed and is not warranted to be accurate, complete or timely. The user assumes all risks for any damages or losses arising from any use of this information,
except to the extent such damages or losses cannot be limited or excluded by applicable law. Past financial performance is no guarantee of future results.