Hertz 2013 Annual Report Download - page 46
Download and view the complete annual report
Please find page 46 of the 2013 Hertz annual report below. You can navigate through the pages in the report by either clicking on the pages listed below, or by using the keyword search tool below to find specific information within the annual report.-
 1
1 -
2
-
3
-
4
-
5
-
6
-
7
-
8
-
9
-
10
-
11
-
12
-
13
-
14
-
15
-
16
-
17
-
18
-
19
-
20
-
21
-
22
-
23
-
24
-
25
-
26
-
27
-
28
-
29
-
30
-
31
-
32
-
33
-
34
-
35
-
 36
36 -
 37
37 -
 38
38 -
 39
39 -
 40
40 -
 41
41 -
 42
42 -
 43
43 -
 44
44 -
 45
45 -
 46
46 -
 47
47 -
 48
48 -
 49
49 -
 50
50 -
 51
51 -
 52
52 -
 53
53 -
 54
54 -
 55
55 -
 56
56 -
57
-
58
-
59
-
60
-
61
-
62
-
63
-
64
-
65
-
66
-
67
-
68
-
69
-
70
-
71
-
72
-
73
-
74
-
75
-
76
-
77
-
78
-
79
-
80
-
81
-
82
-
83
-
84
-
85
-
86
-
87
-
88
-
89
-
90
-
91
-
92
-
93
-
94
-
95
-
96
-
97
-
98
-
99
-
100
-
101
-
102
-
103
-
104
-
105
-
106
-
107
-
108
-
109
-
110
-
111
-
112
-
113
-
114
-
115
-
116
-
117
-
118
-
119
-
120
-
121
-
122
-
123
-
124
-
125
-
126
-
127
-
128
-
129
-
130
-
131
-
132
-
133
-
134
-
135
-
136
-
137
-
138
-
139
-
140
-
141
-
142
-
143
-
144
-
145
-
146
-
147
-
148
-
149
-
150
-
151
-
152
-
153
-
154
-
155
-
156
-
157
-
158
-
159
-
160
-
161
-
162
-
163
-
164
-
165
-
166
-
167
-
168
-
169
-
170
-
171
-
172
-
173
-
174
-
175
-
176
-
177
-
178
-
179
-
180
-
181
-
182
-
183
-
184
-
185
-
186
-
187
-
188
-
189
-
190
-
191
 |
 |

Table of Contents
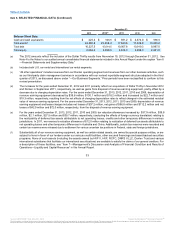
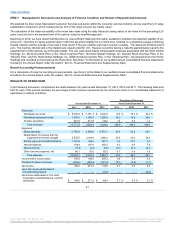
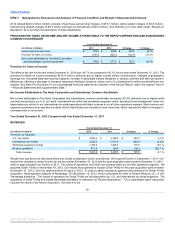
The following table reconciles our car rental segment revenues to our rental rate revenue and rental rate revenue per transaction day (based on
December 31, 2012 foreign exchange rates) for the years ended December 31, 2013, 2012 and 2011 (in millions of dollars, except as noted):
Revenues $6,324.4
$4,893.2
$4,468.9
$2,382.5
$2,268.5
$2,471.9
Advantage sublease revenue (65.0)
(3.7)
—
—
—
—
Foreign currency adjustment —
—
—
40.1
46.0
(96.5)
Total rental revenue $6,259.4
$4,889.5
$4,468.9
$2,422.6
$2,314.5
$2,375.4
Transaction days (in thousands) 133,181
105,539
93,741
45,019
43,248
43,560
Total RPD (in whole dollars) $47.00
$46.33
$47.67
$53.81
$53.52
$54.53
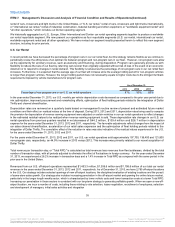
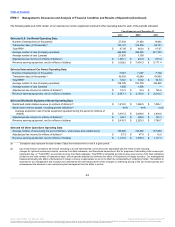
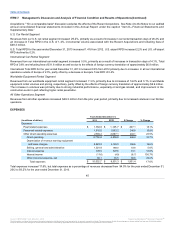
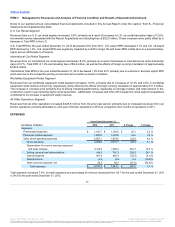
(c) Adjusted pre-tax income is calculated as income before income taxes plus certain non-cash purchase accounting charges, debt-related charges relating
to the amortization and write-off of debt financing costs and debt discounts and certain one-time charges and nonoperational items. Adjusted pre-tax
income is important to management because it allows management to assess operational performance of our business, exclusive of the items mentioned
above. It also allows management to assess the performance of the entire business on the same basis as the segment measure of profitability. Management
believes that it is important to investors for the same reasons it is important to management and because it allows them to assess our operational
performance on the same basis that management uses internally. The contribution of our reportable segments to adjusted pre-tax income and
reconciliation to consolidated amounts are presented below (in millions of dollars):
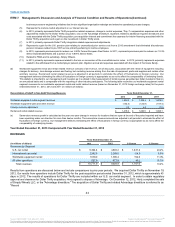
Adjusted pre-tax income:
U.S. car rental $1,091.1
$872.8
$673.2
International car rental 141.2
92.9
145.6
Worldwide equipment rental 292.1
226.2
161.3
All other operations 57.3
47.6
15.0
Total reportable segments 1,581.7
1,239.5
995.1
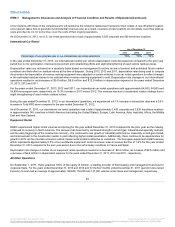
Adjustments:
Other reconciling items(1) (410.7)
(322.2)
(308.2)
Purchase accounting(2) (132.2)
(109.6)
(87.6)
Debt-related charges(3) (48.7)
(56.4)
(105.9)
Restructuring charges (77.0)
(38.0)
(56.4)
Restructuring related charges(4) (21.8)
(11.1)
(9.8)
Derivative gains (losses)(5) (1.0)
(0.9)
0.1
Acquisition related costs and charges(6) (18.5)
(163.7)
(18.8)
Integration expenses(7) (40.0)
—
—
Relocation costs (7.8)
—
—
Management transition costs —
—
(4.0)
Pension adjustment(8) —
—
13.1
Premiums paid on debt(9) (28.7)
—
(62.4)
Impairment charges and other(10) (44.0)
—
—
Other(11) (12.1)
(44.0)
—
Income before income taxes $739.2
$493.6
$355.2
_____________________________________________________________________________
(1) Represents general corporate expenses, certain interest expense (including net interest on corporate debt), as well as other business activities.
(2) Represents the increase in amortization of other intangible assets, depreciation of property and equipment and accretion of revalued liabilities
relating to purchase accounting.
(3) Represents debt-related charges relating to the amortization and write-off of deferred debt financing costs and debt discounts.
(4) Represents incremental costs incurred directly supporting our business transformation initiatives. Such costs include transition costs incurred in
connection with our business process outsourcing arrangements and incremental costs incurred to facilitate
43
Source: HERTZ CORP, 10-K, March 31, 2014 Powered by Morningstar® Document Research℠
The information contained herein may not be copied, adapted or distributed and is not warranted to be accurate, complete or timely. The user assumes all risks for any damages or losses arising from any use of this information,
except to the extent such damages or losses cannot be limited or excluded by applicable law. Past financial performance is no guarantee of future results.