Hertz 2013 Annual Report Download - page 62
Download and view the complete annual report
Please find page 62 of the 2013 Hertz annual report below. You can navigate through the pages in the report by either clicking on the pages listed below, or by using the keyword search tool below to find specific information within the annual report.-
 1
1 -
2
-
3
-
4
-
5
-
6
-
7
-
8
-
9
-
10
-
11
-
12
-
13
-
14
-
15
-
16
-
17
-
18
-
19
-
20
-
21
-
22
-
23
-
24
-
25
-
26
-
27
-
28
-
29
-
30
-
31
-
32
-
33
-
34
-
35
-
36
-
37
-
38
-
39
-
40
-
41
-
42
-
43
-
44
-
45
-
46
-
47
-
48
-
49
-
50
-
51
-
 52
52 -
 53
53 -
 54
54 -
 55
55 -
 56
56 -
 57
57 -
 58
58 -
 59
59 -
 60
60 -
 61
61 -
 62
62 -
 63
63 -
 64
64 -
 65
65 -
 66
66 -
 67
67 -
 68
68 -
 69
69 -
 70
70 -
 71
71 -
 72
72 -
73
-
74
-
75
-
76
-
77
-
78
-
79
-
80
-
81
-
82
-
83
-
84
-
85
-
86
-
87
-
88
-
89
-
90
-
91
-
92
-
93
-
94
-
95
-
96
-
97
-
98
-
99
-
100
-
101
-
102
-
103
-
104
-
105
-
106
-
107
-
108
-
109
-
110
-
111
-
112
-
113
-
114
-
115
-
116
-
117
-
118
-
119
-
120
-
121
-
122
-
123
-
124
-
125
-
126
-
127
-
128
-
129
-
130
-
131
-
132
-
133
-
134
-
135
-
136
-
137
-
138
-
139
-
140
-
141
-
142
-
143
-
144
-
145
-
146
-
147
-
148
-
149
-
150
-
151
-
152
-
153
-
154
-
155
-
156
-
157
-
158
-
159
-
160
-
161
-
162
-
163
-
164
-
165
-
166
-
167
-
168
-
169
-
170
-
171
-
172
-
173
-
174
-
175
-
176
-
177
-
178
-
179
-
180
-
181
-
182
-
183
-
184
-
185
-
186
-
187
-
188
-
189
-
190
-
191
 |
 |

Table of Contents
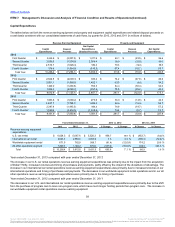
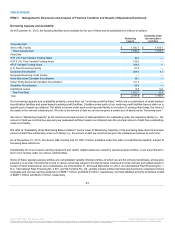
expenditures was primarily due to increased volumes as well as continued improvement in the economic conditions during 2012. The
increase in all other operations was primarily attributable to a full year of Donlen operations in 2012 as compared to four months of
operations in 2011.
Property and equipment expenditures
U.S. car rental $212.9
$191.2
$199.2
$21.7
11.3 %
$(8.0)
(4.0)%
International car rental 47.5
55.8
35.8
(8.3)
(14.9)%
20.0
55.9 %
Worldwide equipment rental 22.3
25.2
31.1
(2.9)
(11.5)%
(5.9)
(19.0)%
All other operations 3.3
2.9
0.2
0.4
13.8 %
2.7
1,350.0 %
Other reconciling items 27.8
22.0
15.4
5.8
26.4 %
6.6
42.9 %
Total $313.8
$ 297.1
$ 281.7
$16.7
5.6 %
$ 15.4
5.5 %
Year ended December 31, 2013 compared with year ended December 31, 2012
The increase in our U.S. car rental operations property and equipment expenditures was primarily due to technology initiatives and an
increase in our operating locations. The decreases in our international car rental operations and worldwide equipment rental operations
property and equipment expenditures were primarily due to timing of purchases and payments. The increases in our all other operations and
other reconciling items property and equipment expenditures were primarily due to technology initiatives and timing of purchases and
payments.
Year ended December 31, 2012 compared with year ended December 31, 2011
The decrease in our U.S. car rental operations property and equipment expenditures was primarily due to timing of purchases and payments,
partly offset by increased locations during the year. The increase in international car rental operations property and equipment expenditures
was primarily due to increased locations during the year. The decrease in our worldwide equipment rental operations property and equipment
expenditures was due to the timing of purchases and payments. The increases in our all other operations and other reconciling items
property and equipment expenditures were primarily due to technology initiatives and timing of purchases and payments.
Our primary liquidity needs include servicing of corporate and fleet related debt, acquisitions, the payment of operating expenses and
purchases of rental vehicles and equipment to be used in our operations. Our primary sources of funding are operating cash flows, cash
received on the disposal of vehicles and equipment, borrowings under our asset-backed securitizations and our asset-based revolving credit
facilities and access to the credit markets generally.
As of December 31, 2013, we had $16,227.5 million of total indebtedness outstanding. Cash paid for interest during the year ended
December 31, 2013, was $631.8 million, net of amounts capitalized. Accordingly, we are highly leveraged and a substantial portion of our
liquidity needs arise from debt service on our indebtedness and from the funding of our costs of operations, capital expenditures and
acquisitions.
Our liquidity as of December 31, 2013 consisted of cash and cash equivalents, unused commitments under our Senior ABL Facility and
unused commitments under our fleet debt. For a description of these amounts, see Note 5 to the Notes to our audited annual consolidated
financial statements included in this Annual Report under caption “Item 8—Financial Statements and Supplementary Data.”
As of December 31, 2013, a requirement under the HVF II Series 2013-B Notes was unknowingly not met, resulting in the occurrence of an
amortization event under the HVF II Series 2013-B Notes that also triggered amortization events under certain other series of our outstanding
U.S. rental car variable funding notes. As a result of the amortization event, our ability to borrow under these notes was temporarily restricted
at December 31, 2013. Upon discovery in January 2014 of such requirement not being met, Hertz promptly obtained waivers from 100% of
the noteholders required to waive and cure such amortization events and provided the required notices.
59
Source: HERTZ CORP, 10-K, March 31, 2014 Powered by Morningstar® Document Research℠
The information contained herein may not be copied, adapted or distributed and is not warranted to be accurate, complete or timely. The user assumes all risks for any damages or losses arising from any use of this information,
except to the extent such damages or losses cannot be limited or excluded by applicable law. Past financial performance is no guarantee of future results.