Hertz 2013 Annual Report Download - page 36
Download and view the complete annual report
Please find page 36 of the 2013 Hertz annual report below. You can navigate through the pages in the report by either clicking on the pages listed below, or by using the keyword search tool below to find specific information within the annual report.-
 1
1 -
2
-
3
-
4
-
5
-
6
-
7
-
8
-
9
-
10
-
11
-
12
-
13
-
14
-
15
-
16
-
17
-
18
-
19
-
20
-
21
-
22
-
23
-
24
-
25
-
 26
26 -
 27
27 -
 28
28 -
 29
29 -
 30
30 -
 31
31 -
 32
32 -
 33
33 -
 34
34 -
 35
35 -
 36
36 -
 37
37 -
 38
38 -
 39
39 -
 40
40 -
 41
41 -
 42
42 -
 43
43 -
 44
44 -
 45
45 -
 46
46 -
47
-
48
-
49
-
50
-
51
-
52
-
53
-
54
-
55
-
56
-
57
-
58
-
59
-
60
-
61
-
62
-
63
-
64
-
65
-
66
-
67
-
68
-
69
-
70
-
71
-
72
-
73
-
74
-
75
-
76
-
77
-
78
-
79
-
80
-
81
-
82
-
83
-
84
-
85
-
86
-
87
-
88
-
89
-
90
-
91
-
92
-
93
-
94
-
95
-
96
-
97
-
98
-
99
-
100
-
101
-
102
-
103
-
104
-
105
-
106
-
107
-
108
-
109
-
110
-
111
-
112
-
113
-
114
-
115
-
116
-
117
-
118
-
119
-
120
-
121
-
122
-
123
-
124
-
125
-
126
-
127
-
128
-
129
-
130
-
131
-
132
-
133
-
134
-
135
-
136
-
137
-
138
-
139
-
140
-
141
-
142
-
143
-
144
-
145
-
146
-
147
-
148
-
149
-
150
-
151
-
152
-
153
-
154
-
155
-
156
-
157
-
158
-
159
-
160
-
161
-
162
-
163
-
164
-
165
-
166
-
167
-
168
-
169
-
170
-
171
-
172
-
173
-
174
-
175
-
176
-
177
-
178
-
179
-
180
-
181
-
182
-
183
-
184
-
185
-
186
-
187
-
188
-
189
-
190
-
191
 |
 |

Table of Contents
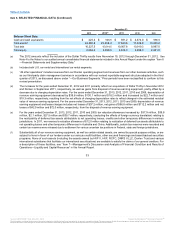
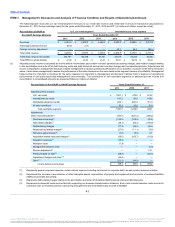
Cash and cash equivalents $423.2
$545.5
$931.2
$2,374.0
$985.5
Total assets(f) 24,680.8
23,268.4
17,640.6
17,329.8
16,009.2
Total debt 16,227.5
15,014.5
10,907.8
10,919.3
9,997.0
Total equity 2,884.4
2,896.5
2,612.3
2,498.0
2,461.9
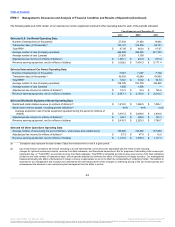
(a) The 2012 amounts reflect the inclusion of the Dollar Thrifty results from November 19, 2012 through December 31, 2012. See
Note 4 to the Notes to our audited annual consolidated financial statements included in this Annual Report under the caption “Item 8
—Financial Statements and Supplementary Data."
(b) Includes both U.S. car rental and international car rental segments.
(c) “All other operations” includes revenues from our Donlen operating segment and revenues from our other business activities, such
as our third-party claim management services in accordance with our revised reportable segment structure adopted in the third
quarter of 2013, as discussed above under “—Our Business Segments.” Prior periods have been reclassified to conform to this
revised presentation.
(d) The increases for the years ended December 31, 2012 and 2011 primarily reflect our acquisitions of Dollar Thrifty in November 2012
and Donlen in September 2011, respectively, as well as gains from disposal of revenue earning equipment, partly offset by a
decrease due to changing depreciation rates. For the years ended December 31, 2013, 2012, 2011, 2010 and 2009, depreciation of
revenue earning equipment decreased by $39.6 million, $130.1 million and $18.2 million and increased by $22.7 million and
$19.3 million, respectively, resulting from the net effects of changing depreciation rates to reflect changes in the estimated residual
value of revenue earning equipment. For the years ended December 31, 2013, 2012, 2011, 2010 and 2009, depreciation of revenue
earning equipment and lease charges includes net losses of $37.2 million, net gains of $96.8 million and $112.2 million and net
losses of $42.9 million and $72.0 million, respectively, from the disposal of revenue earning equipment.
(e) For the years ended December 31, 2013, 2012, 2011, 2010 and 2009, tax valuation allowances increased by $37.9 million, $39.8
million, $2.1 million, $27.5 million and $39.7 million, respectively, (excluding the effects of foreign currency translation) relating to
the realizability of deferred tax assets attributable to net operating losses, credits and other temporary differences in various
jurisdictions. In 2011, we reversed a valuation allowance of $12.0 million relating to realization of deferred tax assets attributable to
net operating losses and other temporary differences in Australia and China. Additionally, certain tax reserves were recorded and
certain tax reserves were released due to settlement for various uncertain tax positions in Federal, state and foreign jurisdictions.
(f) Substantially all of our revenue earning equipment, as well as certain related assets, are owned by special purpose entities, or are
subject to liens in favor of our lenders under our various credit facilities, other secured financings and asset-backed securities
programs. None of such assets (including the assets owned by HVF II, HVF, RCFC, DNRS II LLC, Donlen Trust and various
international subsidiaries that facilitate our international securitizations) are available to satisfy the claims of our general creditors. For
a description of those facilities, see “Item 7—Management's Discussion and Analysis of Financial Condition and Results of
Operations—Liquidity and Capital Resources” in this Annual Report.
33
Source: HERTZ CORP, 10-K, March 31, 2014 Powered by Morningstar® Document Research℠
The information contained herein may not be copied, adapted or distributed and is not warranted to be accurate, complete or timely. The user assumes all risks for any damages or losses arising from any use of this information,
except to the extent such damages or losses cannot be limited or excluded by applicable law. Past financial performance is no guarantee of future results.