Hertz 2013 Annual Report Download - page 112
Download and view the complete annual report
Please find page 112 of the 2013 Hertz annual report below. You can navigate through the pages in the report by either clicking on the pages listed below, or by using the keyword search tool below to find specific information within the annual report.-
 1
1 -
2
-
3
-
4
-
5
-
6
-
7
-
8
-
9
-
10
-
11
-
12
-
13
-
14
-
15
-
16
-
17
-
18
-
19
-
20
-
21
-
22
-
23
-
24
-
25
-
26
-
27
-
28
-
29
-
30
-
31
-
32
-
33
-
34
-
35
-
36
-
37
-
38
-
39
-
40
-
41
-
42
-
43
-
44
-
45
-
46
-
47
-
48
-
49
-
50
-
51
-
52
-
53
-
54
-
55
-
56
-
57
-
58
-
59
-
60
-
61
-
62
-
63
-
64
-
65
-
66
-
67
-
68
-
69
-
70
-
71
-
72
-
73
-
74
-
75
-
76
-
77
-
78
-
79
-
80
-
81
-
82
-
83
-
84
-
85
-
86
-
87
-
88
-
89
-
90
-
91
-
92
-
93
-
94
-
95
-
96
-
97
-
98
-
99
-
100
-
101
-
 102
102 -
 103
103 -
 104
104 -
 105
105 -
 106
106 -
 107
107 -
 108
108 -
 109
109 -
 110
110 -
 111
111 -
 112
112 -
 113
113 -
 114
114 -
 115
115 -
 116
116 -
 117
117 -
 118
118 -
 119
119 -
 120
120 -
 121
121 -
 122
122 -
123
-
124
-
125
-
126
-
127
-
128
-
129
-
130
-
131
-
132
-
133
-
134
-
135
-
136
-
137
-
138
-
139
-
140
-
141
-
142
-
143
-
144
-
145
-
146
-
147
-
148
-
149
-
150
-
151
-
152
-
153
-
154
-
155
-
156
-
157
-
158
-
159
-
160
-
161
-
162
-
163
-
164
-
165
-
166
-
167
-
168
-
169
-
170
-
171
-
172
-
173
-
174
-
175
-
176
-
177
-
178
-
179
-
180
-
181
-
182
-
183
-
184
-
185
-
186
-
187
-
188
-
189
-
190
-
191
 |
 |

Table of Contents
Accrued liabilities $(108.1)
$(180.5)
$(36.2)
$(46.1)
$(15.5)
$(19.0)
Net obligation recognized in the balance sheet $(108.1)
$(180.5)
$(36.2)
$(46.1)
$(15.5)
$(19.0)
Prior service credit (cost) $13.1
$9.1
$ —
$ —
$ —
$ —
Net gain (loss) (80.8)
(167.6)
(12.1)
(17.5)
0.7
(2.3)
Accumulated other comprehensive gain (loss) (67.7)
(158.5)
(12.1)
(17.5)
0.7
(2.3)
Unfunded accrued pension or postretirement
benefit (40.4)
(22.0)
(24.1)
(28.6)
(16.2)
(16.7)
Net obligation recognized in the balance sheet $(108.1)
$(180.5)
$(36.2)
$(46.1)
$(15.5)
$(19.0)
$(90.8)
$8.3
$(5.4)
$6.8
$(3.0)
$1.1
$(52.1)
$43.5
$(6.0)
$6.1
$(2.2)
$2.1
Net gain (loss) $(8.9)
$(16.0)
$ —
$(0.4)
$ —
$(0.1)
$625.6
$619.2
$239.2
$216.8
N/A
N/A
Discount rate 4.8%
4.0%
4.4%
4.3%
4.4%
3.6%
Expected return on assets 7.6%
7.6%
7.4%
7.4%
N/A
N/A
Average rate of increase in compensation 4.6%
4.6%
2.6%
2.0%
N/A
N/A
Initial health care cost trend rate N/A
N/A
N/A
N/A
7.5%
7.8%
Ultimate health care cost trend rate N/A
N/A
N/A
N/A
4.5%
4.5%
Number of years to ultimate trend rate N/A
N/A
N/A
N/A
16
17
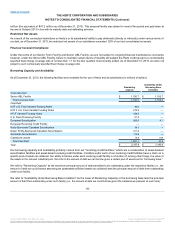
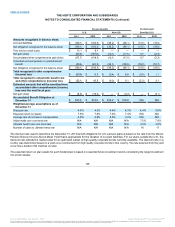
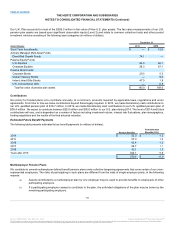
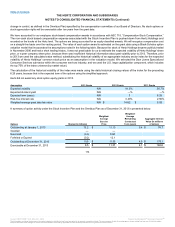
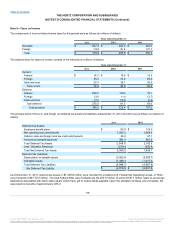
The discount rate used to determine the December 31, 2013 benefit obligations for U.S. pension plans is based on the rate from the Mercer
Pension Discount Curve-Above Mean Yield that is appropriate for the duration of our plan liabilities. For our plans outside the U.S., the
discount rate reflects the market rates for an optimized subset of high-quality corporate bonds currently available. The discount rate in a
country was determined based on a yield curve constructed from high quality corporate bonds in that country. The rate selected from the yield
curve has a duration that matches our plan.
The expected return on plan assets for each funded plan is based on expected future investment returns considering the target investment
mix of plan assets.
108
Source: HERTZ CORP, 10-K, March 31, 2014 Powered by Morningstar® Document Research℠
The information contained herein may not be copied, adapted or distributed and is not warranted to be accurate, complete or timely. The user assumes all risks for any damages or losses arising from any use of this information,
except to the extent such damages or losses cannot be limited or excluded by applicable law. Past financial performance is no guarantee of future results.