Hertz 2013 Annual Report Download - page 45
Download and view the complete annual report
Please find page 45 of the 2013 Hertz annual report below. You can navigate through the pages in the report by either clicking on the pages listed below, or by using the keyword search tool below to find specific information within the annual report.-
 1
1 -
2
-
3
-
4
-
5
-
6
-
7
-
8
-
9
-
10
-
11
-
12
-
13
-
14
-
15
-
16
-
17
-
18
-
19
-
20
-
21
-
22
-
23
-
24
-
25
-
26
-
27
-
28
-
29
-
30
-
31
-
32
-
33
-
34
-
 35
35 -
 36
36 -
 37
37 -
 38
38 -
 39
39 -
 40
40 -
 41
41 -
 42
42 -
 43
43 -
 44
44 -
 45
45 -
 46
46 -
 47
47 -
 48
48 -
 49
49 -
 50
50 -
 51
51 -
 52
52 -
 53
53 -
 54
54 -
 55
55 -
56
-
57
-
58
-
59
-
60
-
61
-
62
-
63
-
64
-
65
-
66
-
67
-
68
-
69
-
70
-
71
-
72
-
73
-
74
-
75
-
76
-
77
-
78
-
79
-
80
-
81
-
82
-
83
-
84
-
85
-
86
-
87
-
88
-
89
-
90
-
91
-
92
-
93
-
94
-
95
-
96
-
97
-
98
-
99
-
100
-
101
-
102
-
103
-
104
-
105
-
106
-
107
-
108
-
109
-
110
-
111
-
112
-
113
-
114
-
115
-
116
-
117
-
118
-
119
-
120
-
121
-
122
-
123
-
124
-
125
-
126
-
127
-
128
-
129
-
130
-
131
-
132
-
133
-
134
-
135
-
136
-
137
-
138
-
139
-
140
-
141
-
142
-
143
-
144
-
145
-
146
-
147
-
148
-
149
-
150
-
151
-
152
-
153
-
154
-
155
-
156
-
157
-
158
-
159
-
160
-
161
-
162
-
163
-
164
-
165
-
166
-
167
-
168
-
169
-
170
-
171
-
172
-
173
-
174
-
175
-
176
-
177
-
178
-
179
-
180
-
181
-
182
-
183
-
184
-
185
-
186
-
187
-
188
-
189
-
190
-
191
 |
 |
Table of Contents
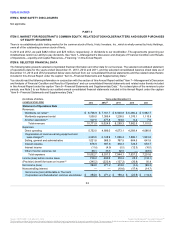
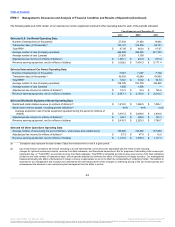
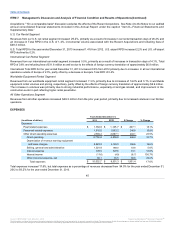
The following table sets forth certain of our selected car rental, equipment rental and other operating data for each of the periods indicated:
Number of transactions (in thousands) 27,093
21,920
19,903
Transaction days (in thousands)(a) 133,181
105,539
93,741
Total RPD(b) $47.00
$ 46.33
$47.67
Average number of cars (Company-operated) 468,500
358,000
321,700
Average number of cars (Leased) 21,500
1,100
—
Adjusted pre-tax income (in millions of dollars) (c) $ 1,091.1
$872.8
$673.2
Revenue earning equipment, net (in millions of dollars) $8,629.0
$7,434.3
$5,177.4
Number of transactions (in thousands) 7,527
7,207
7,192
Transaction days (in thousands)(a) 45,019
43,248
43,560
Total RPD(b) $53.81
$ 53.52
$ 54.53
Average number of cars (Company-operated) 159,700
153,700
156,900
Average number of cars (Leased) 1,600
1,400
—
Adjusted pre-tax income (in millions of dollars) (c) $ 141.2
$92.9
$ 145.6
Revenue earning equipment, net (in millions of dollars) $2,047.1
$2,163.6
$2,010.2
Rental and rental related revenue (in millions of dollars) (d) $1,415.0
$1,266.5
$ 1,095.1
Same-store revenue growth, including growth initiatives (e) 9.6%
8.6%
9.3%
Average acquisition cost of rental equipment operated during the period (in millions of
dollars) $3,401.2
$ 3,069.0
$2,804.8
Adjusted pre-tax income (in millions of dollars) (c) $292.1
$ 226.2
$ 161.3
Revenue earning equipment, net (in millions of dollars) $2,416.3
$2,203.3
$1,786.7
Average number of cars during the period (Donlen - under lease and maintenance) 169,600
150,800
137,000
Adjusted pre-tax income (in millions of dollars) (c) $57.3
$47.6
$ 15.0
Revenue earning equipment, net (in millions of dollars) $1,101.0
$ 1,095.4
$1,117.3
_______________________________________________________________________________
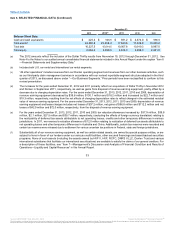
(a) Transaction days represent the total number of days that vehicles were on rent in a given period.
(b) Car rental revenue consists of all revenue (including U.S. and International), net of discounts, associated with the rental of cars including
charges for optional insurance products, revenue from fleet subleases, and franchisee transactions. But for purposes of calculating total revenue per
transaction day, or “Total RPD,” we exclude revenue from fleet subleases. Total RPD is calculated as total revenue less revenue from fleet subleases,
divided by the total number of transaction days, with all periods adjusted to eliminate the effect of fluctuations in foreign currency. Our management
believes eliminating the effect of fluctuations in foreign currency is appropriate so as not to affect the comparability of underlying trends. This statistic is
important to our management and investors as it represents the best measurement of the changes in underlying pricing in the car rental business and
encompasses the elements in car rental pricing that management has the ability to control.
42
Source: HERTZ CORP, 10-K, March 31, 2014 Powered by Morningstar® Document Research℠
The information contained herein may not be copied, adapted or distributed and is not warranted to be accurate, complete or timely. The user assumes all risks for any damages or losses arising from any use of this information,
except to the extent such damages or losses cannot be limited or excluded by applicable law. Past financial performance is no guarantee of future results.