Hertz 2013 Annual Report Download - page 39
Download and view the complete annual report
Please find page 39 of the 2013 Hertz annual report below. You can navigate through the pages in the report by either clicking on the pages listed below, or by using the keyword search tool below to find specific information within the annual report.-
 1
1 -
2
-
3
-
4
-
5
-
6
-
7
-
8
-
9
-
10
-
11
-
12
-
13
-
14
-
15
-
16
-
17
-
18
-
19
-
20
-
21
-
22
-
23
-
24
-
25
-
26
-
27
-
28
-
 29
29 -
 30
30 -
 31
31 -
 32
32 -
 33
33 -
 34
34 -
 35
35 -
 36
36 -
 37
37 -
 38
38 -
 39
39 -
 40
40 -
 41
41 -
 42
42 -
 43
43 -
 44
44 -
 45
45 -
 46
46 -
 47
47 -
 48
48 -
 49
49 -
50
-
51
-
52
-
53
-
54
-
55
-
56
-
57
-
58
-
59
-
60
-
61
-
62
-
63
-
64
-
65
-
66
-
67
-
68
-
69
-
70
-
71
-
72
-
73
-
74
-
75
-
76
-
77
-
78
-
79
-
80
-
81
-
82
-
83
-
84
-
85
-
86
-
87
-
88
-
89
-
90
-
91
-
92
-
93
-
94
-
95
-
96
-
97
-
98
-
99
-
100
-
101
-
102
-
103
-
104
-
105
-
106
-
107
-
108
-
109
-
110
-
111
-
112
-
113
-
114
-
115
-
116
-
117
-
118
-
119
-
120
-
121
-
122
-
123
-
124
-
125
-
126
-
127
-
128
-
129
-
130
-
131
-
132
-
133
-
134
-
135
-
136
-
137
-
138
-
139
-
140
-
141
-
142
-
143
-
144
-
145
-
146
-
147
-
148
-
149
-
150
-
151
-
152
-
153
-
154
-
155
-
156
-
157
-
158
-
159
-
160
-
161
-
162
-
163
-
164
-
165
-
166
-
167
-
168
-
169
-
170
-
171
-
172
-
173
-
174
-
175
-
176
-
177
-
178
-
179
-
180
-
181
-
182
-
183
-
184
-
185
-
186
-
187
-
188
-
189
-
190
-
191
 |
 |

Table of Contents
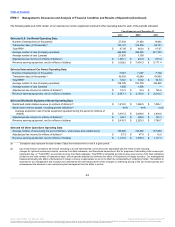
of our systems with those of the companies who will reimburse the location's replacement renters for their rentals. A new off-airport location,
once opened, takes time to generate its full potential revenues and, as a result, revenues at new locations do not initially cover their start-up
costs and often do not, for some time, cover the costs of their ongoing operations.
As of December 31, 2013, our U.S. car rental operations had a total of approximately 5,550 corporate and 560 franchisee locations.
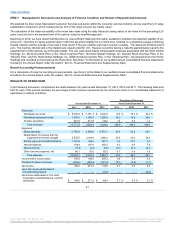
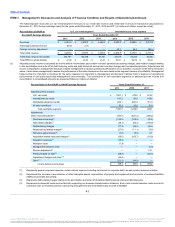
International Car Rental
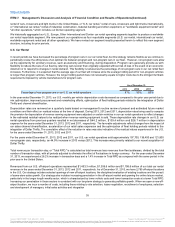
Percentage of non-program cars in our international car rental operations 76%
79%
75%
In the year ended December 31, 2013, our international monthly per vehicle depreciation costs decreased as compared to the prior year
period due to mix optimization, improved procurement and remarketing efforts and slight strengthening of used vehicle residual values.
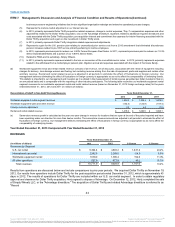
Depreciation rates are reviewed on a quarterly basis based on management's routine review of present and estimated future market
conditions and their effect on residual values at the time of disposal. During 2013, 2012 and 2011, depreciation rates being used to compute
the provision for depreciation of revenue earning equipment were adjusted on certain vehicles in our car rental operations to reflect changes
in the estimated residual values to be realized when revenue earning equipment is sold. Depreciation rate changes in our international
operations resulted in net increases of $5.0 million, $8.8 million and $12.9 million in depreciation expense for the years ended December
31, 2013, 2012 and 2011.
For the years ended December 31, 2013, 2012 and 2011, our international car rental operations sold approximately 64,500, 54,500 and
54,800 non-program cars, respectively, an 18.3% increase in 2013 versus 2012. This increase was due to accelerated rotation strategy due to
slight strengthening of used vehicle residual values.
During the year ended December 31, 2013, in our international operations, we experienced a 4.1% increase in transaction days and a 0.6%
increase in Total RPD when compared to the year ended December 31, 2012.
As of December 31, 2013, our international car rental operations had a total of approximately 1,450 corporate and 3,930 franchisee locations
in approximately 145 countries in North America (excluding the United States), Europe, Latin America, Asia, Australia, Africa, the Middle
East and New Zealand.
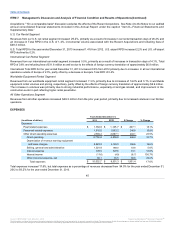
Equipment Rental
HERC experienced higher rental volumes and pricing for the year ended December 31, 2013 compared to the prior year as the industry
continued its recovery in North America. The recovery has been led by continued strength in oil and gas, industrial and specialty markets,
and the early beginnings of the construction recovery. We continued to see growth in industrial performance, especially oil and gas related,
and improvement in the construction sector in part reflecting higher rental penetration. Additionally, there continue to be opportunities for
growth in 2014 as the uncertain economic outlook makes rental solutions attractive to customers. Our European equipment rental business,
which represents approximately 6.5% of our worldwide equipment rental revenues, saw a revenue decline of 1.9% for the year ended
December 31, 2013 compared to the prior year period, due to the soft industry conditions in France and Spain.
Depreciation rate changes in certain of our equipment rental operations resulted in a decrease of $0.4 million, an increase of $0.5 million and
a decrease of $4.4 million in depreciation expense for the years ended December 31, 2013, 2012 and 2011, respectively.
All Other Operations
On September 1, 2011, Hertz acquired 100% of the equity of Donlen, a leading provider of fleet leasing and management services for
corporate fleets. For the years ended December 31, 2013 and 2012 and for the four months ended December 31, 2011 (period it was owned
by Hertz), Donlen had an average of approximately 169,600, 150,800 and 137,000 vehicles under lease and management, respectively.
36
Source: HERTZ CORP, 10-K, March 31, 2014 Powered by Morningstar® Document Research℠
The information contained herein may not be copied, adapted or distributed and is not warranted to be accurate, complete or timely. The user assumes all risks for any damages or losses arising from any use of this information,
except to the extent such damages or losses cannot be limited or excluded by applicable law. Past financial performance is no guarantee of future results.