Hertz 2013 Annual Report Download - page 60
Download and view the complete annual report
Please find page 60 of the 2013 Hertz annual report below. You can navigate through the pages in the report by either clicking on the pages listed below, or by using the keyword search tool below to find specific information within the annual report.-
 1
1 -
2
-
3
-
4
-
5
-
6
-
7
-
8
-
9
-
10
-
11
-
12
-
13
-
14
-
15
-
16
-
17
-
18
-
19
-
20
-
21
-
22
-
23
-
24
-
25
-
26
-
27
-
28
-
29
-
30
-
31
-
32
-
33
-
34
-
35
-
36
-
37
-
38
-
39
-
40
-
41
-
42
-
43
-
44
-
45
-
46
-
47
-
48
-
49
-
 50
50 -
 51
51 -
 52
52 -
 53
53 -
 54
54 -
 55
55 -
 56
56 -
 57
57 -
 58
58 -
 59
59 -
 60
60 -
 61
61 -
 62
62 -
 63
63 -
 64
64 -
 65
65 -
 66
66 -
 67
67 -
 68
68 -
 69
69 -
 70
70 -
71
-
72
-
73
-
74
-
75
-
76
-
77
-
78
-
79
-
80
-
81
-
82
-
83
-
84
-
85
-
86
-
87
-
88
-
89
-
90
-
91
-
92
-
93
-
94
-
95
-
96
-
97
-
98
-
99
-
100
-
101
-
102
-
103
-
104
-
105
-
106
-
107
-
108
-
109
-
110
-
111
-
112
-
113
-
114
-
115
-
116
-
117
-
118
-
119
-
120
-
121
-
122
-
123
-
124
-
125
-
126
-
127
-
128
-
129
-
130
-
131
-
132
-
133
-
134
-
135
-
136
-
137
-
138
-
139
-
140
-
141
-
142
-
143
-
144
-
145
-
146
-
147
-
148
-
149
-
150
-
151
-
152
-
153
-
154
-
155
-
156
-
157
-
158
-
159
-
160
-
161
-
162
-
163
-
164
-
165
-
166
-
167
-
168
-
169
-
170
-
171
-
172
-
173
-
174
-
175
-
176
-
177
-
178
-
179
-
180
-
181
-
182
-
183
-
184
-
185
-
186
-
187
-
188
-
189
-
190
-
191
 |
 |

Table of Contents
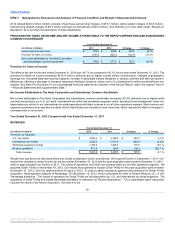
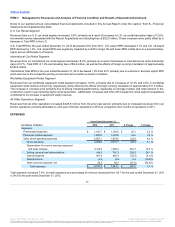
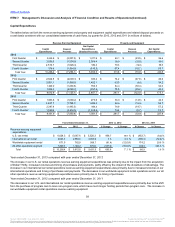
Our domestic and international operations are funded by cash provided by operating activities and by extensive financing arrangements
maintained by us in the United States and internationally.
As of December 31, 2013, we had cash and cash equivalents of $423.2 million, a decrease of $122.3 million from $545.5 million as of
December 31, 2012. The following table summarizes such decrease:
Cash provided by (used in):
Operating activities $3,611.5
$2,740.2
$2,236.1
$ 871.3
$ 504.1
Investing activities (3,838.9)
(4,726.9)
(2,170.5)
888.0
(2,556.4)
Financing activities 105.1
1,595.3
(1,512.2)
(1,490.2)
3,107.5
Effect of exchange rate changes —
5.7
3.8
(5.7)
1.9
Net change in cash and cash equivalents $(122.3)
$(385.7)
$(1,442.8)
$ 263.4
$1,057.1
During the year ended December 31, 2013, we generated $871.3 million more cash from operating activities compared with the same period
in 2012. The increase was primarily a result of higher earnings before interest, depreciation and amortization as well as due to the timing of
our payments.
Our primary use of cash in investing activities is for the acquisition of revenue earning equipment, which consists of cars and equipment.
During the year ended December 31, 2013, we used $888.0 million less cash for investing activities compared with the same period in
2012. The decrease in the use of funds was primarily due to a decrease in acquisition costs (as the Dollar Thrifty acquisition occurred during
the prior year) increases in proceeds from disposal of revenue earning equipment and in the year-over-year change in restricted cash and
cash equivalents, partly offset by an increase in revenue earning equipment expenditures, decrease in proceeds from disposal of business
and disposal of property and equipment during the year. As of December 31, 2013 and 2012, we had $859.9 million and $551.6 million,
respectively, of restricted cash and cash equivalents to be used for the purchase of revenue earning vehicles and other specified uses under
our fleet financing facilities, our Like Kind Exchange Program, or "LKE Program," and to satisfy certain of our self-insurance regulatory
reserve requirements. The increase in restricted cash and cash equivalents of $308.3 million from December 31, 2012 to December 31,
2013, primarily related to the increased fleet due to the acquisition of Dollar Thrifty.
During the year ended December 31, 2013, cash flows from financing activities decreased by $1,490.2 million compared with the same
period in 2012. The decrease was primarily related to the 2012 issuance of incremental Senior Notes and incurrence of incremental Term
Loans related to the Dollar Thrifty acquisition and higher payments of pre-funded debt associated with our Senior Note redemptions in the
prior year.
We anticipate that our expenditures related to the move of our corporate headquarters to Estero, Florida for employee relocation, severance
and associated costs will be in the range of $40 million to $45 million to be incurred over the next two years.
The Company intends to lease it's new headquarters building in Estero, Florida and does not expect to incur any significant cash outlays
related to its construction.
57
Source: HERTZ CORP, 10-K, March 31, 2014 Powered by Morningstar® Document Research℠
The information contained herein may not be copied, adapted or distributed and is not warranted to be accurate, complete or timely. The user assumes all risks for any damages or losses arising from any use of this information,
except to the extent such damages or losses cannot be limited or excluded by applicable law. Past financial performance is no guarantee of future results.