Hertz 2013 Annual Report Download - page 56
Download and view the complete annual report
Please find page 56 of the 2013 Hertz annual report below. You can navigate through the pages in the report by either clicking on the pages listed below, or by using the keyword search tool below to find specific information within the annual report.-
 1
1 -
2
-
3
-
4
-
5
-
6
-
7
-
8
-
9
-
10
-
11
-
12
-
13
-
14
-
15
-
16
-
17
-
18
-
19
-
20
-
21
-
22
-
23
-
24
-
25
-
26
-
27
-
28
-
29
-
30
-
31
-
32
-
33
-
34
-
35
-
36
-
37
-
38
-
39
-
40
-
41
-
42
-
43
-
44
-
45
-
 46
46 -
 47
47 -
 48
48 -
 49
49 -
 50
50 -
 51
51 -
 52
52 -
 53
53 -
 54
54 -
 55
55 -
 56
56 -
 57
57 -
 58
58 -
 59
59 -
 60
60 -
 61
61 -
 62
62 -
 63
63 -
 64
64 -
 65
65 -
 66
66 -
67
-
68
-
69
-
70
-
71
-
72
-
73
-
74
-
75
-
76
-
77
-
78
-
79
-
80
-
81
-
82
-
83
-
84
-
85
-
86
-
87
-
88
-
89
-
90
-
91
-
92
-
93
-
94
-
95
-
96
-
97
-
98
-
99
-
100
-
101
-
102
-
103
-
104
-
105
-
106
-
107
-
108
-
109
-
110
-
111
-
112
-
113
-
114
-
115
-
116
-
117
-
118
-
119
-
120
-
121
-
122
-
123
-
124
-
125
-
126
-
127
-
128
-
129
-
130
-
131
-
132
-
133
-
134
-
135
-
136
-
137
-
138
-
139
-
140
-
141
-
142
-
143
-
144
-
145
-
146
-
147
-
148
-
149
-
150
-
151
-
152
-
153
-
154
-
155
-
156
-
157
-
158
-
159
-
160
-
161
-
162
-
163
-
164
-
165
-
166
-
167
-
168
-
169
-
170
-
171
-
172
-
173
-
174
-
175
-
176
-
177
-
178
-
179
-
180
-
181
-
182
-
183
-
184
-
185
-
186
-
187
-
188
-
189
-
190
-
191
 |
 |

Table of Contents
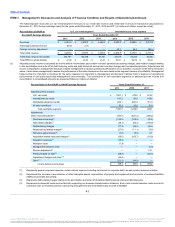
Worldwide Equipment Rental Segment
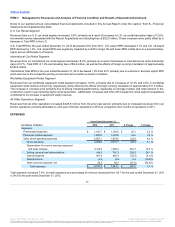
Direct operating expenses for our worldwide equipment rental segment of $770.2 million for 2012 increased $39.4 million, or 5.4% from
$730.8 million for 2011 as a result of increases in personnel related expenses and fleet related expenses, partly offset by a decrease in other
direct operating expenses.
Fleet related expenses for our worldwide equipment rental segment of $213.5 million for 2012 increased $19.7 million, or 10.2%
from 2011. The increase was primarily related to increased rental volume resulting in increased freight expenses of $11.4 million,
higher maintenance costs of $5.9 million and increased delivery costs of $4.3 million. Additionally, Cinelease and other 2012
equipment rental segment acquisitions added to the increase of fleet related expenses. These increases were partly offset by the
effects of foreign currency translation of approximately $1.9 million.
Personnel related expenses for our worldwide equipment rental segment of $244.8 million for 2012 increased $22.6 million, or
10.2% from 2011. The increase was attributable to an increase in salaries and related expenses of $18.2 million and an increase in
benefits of $4.8 million primarily related to increased volumes and new branch openings. Additionally, Cinelease and other 2012
equipment rental segment acquisitions added to the increase of personnel related expenses. These increases were partly offset by
the effects of foreign currency translation of approximately $2.5 million.
Other direct operating expenses for our worldwide equipment rental segment of $311.9 million for 2012 decreased $2.9 million, or
0.9% from 2011. The decrease was primarily related to the effects of foreign currency translation of approximately $2.6 million.
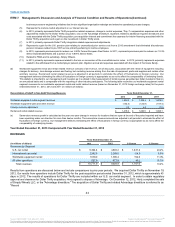
All Other Operations Segment
Direct operating expenses in our all other operations segment of $23.5 million for 2012 increased $13.6 million, or 137.4%, from $9.9
million for 2011 as a result of increases in fleet related expenses, personnel related expenses and other direct operating expenses primarily
attributable to a full year of Donlen operations in 2012 as compared to four months of operations in 2011.
Fleet related expenses in our all other operations segment of $0.5 million for 2012 increased $0.2 million, or 81.9%, from 2011.
Personnel related expenses in our all other operations segment of $24.4 million for 2012 increased $8.3 million, or 51.6%, from
2011. The increase was primarily related to increased salaries and related expenses in our Donlen operations.
Other direct operating expenses in our all other operations segment of $(1.4) million for 2012 increased $5.1 million, or 77.8%, from
2011. The increase was primarily related to expenses in our Donlen operations.
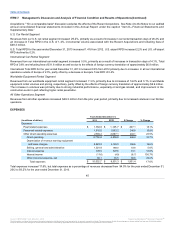
Depreciation of Revenue Earning Equipment and Lease Charges
U.S. Car Rental Segment
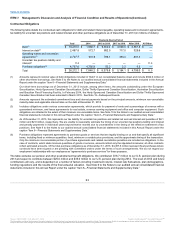
Depreciation of revenue earning equipment and lease charges for our U.S. car rental segment of $940.6 million for 2012 decreased $31.1
million, or 3.2% from $971.7 million for 2011. The decrease was primarily due to lower net depreciation per vehicle, higher vehicle residual
values and a higher mix of non-program cars. The decrease was partly offset by increases attributable to the higher average fleet due to the
Recent Acquisitions.
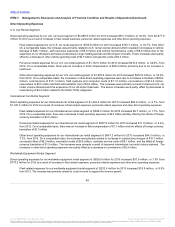
International Car Rental Segment
Depreciation of revenue earning equipment and lease charges for our international car rental segment of $528.2 million for 2012 decreased
$25.0 million, or 4.5% from $553.2 million for 2011. The decrease was primarily due to lower net
53
Source: HERTZ CORP, 10-K, March 31, 2014 Powered by Morningstar® Document Research℠
The information contained herein may not be copied, adapted or distributed and is not warranted to be accurate, complete or timely. The user assumes all risks for any damages or losses arising from any use of this information,
except to the extent such damages or losses cannot be limited or excluded by applicable law. Past financial performance is no guarantee of future results.