Hertz 2011 Annual Report Download - page 94
Download and view the complete annual report
Please find page 94 of the 2011 Hertz annual report below. You can navigate through the pages in the report by either clicking on the pages listed below, or by using the keyword search tool below to find specific information within the annual report.-
 1
1 -
2
-
3
-
4
-
5
-
6
-
7
-
8
-
9
-
10
-
11
-
12
-
13
-
14
-
15
-
16
-
17
-
18
-
19
-
20
-
21
-
22
-
23
-
24
-
25
-
26
-
27
-
28
-
29
-
30
-
31
-
32
-
33
-
34
-
35
-
36
-
37
-
38
-
39
-
40
-
41
-
42
-
43
-
44
-
45
-
46
-
47
-
48
-
49
-
50
-
51
-
52
-
53
-
54
-
55
-
56
-
57
-
58
-
59
-
60
-
61
-
62
-
63
-
64
-
65
-
66
-
67
-
68
-
69
-
70
-
71
-
72
-
73
-
74
-
75
-
76
-
77
-
78
-
79
-
80
-
81
-
82
-
83
-
 84
84 -
 85
85 -
 86
86 -
 87
87 -
 88
88 -
 89
89 -
 90
90 -
 91
91 -
 92
92 -
 93
93 -
 94
94 -
 95
95 -
 96
96 -
 97
97 -
 98
98 -
 99
99 -
 100
100 -
 101
101 -
 102
102 -
 103
103 -
 104
104 -
105
-
106
-
107
-
108
-
109
-
110
-
111
-
112
-
113
-
114
-
115
-
116
-
117
-
118
-
119
-
120
-
121
-
122
-
123
-
124
-
125
-
126
-
127
-
128
-
129
-
130
-
131
-
132
-
133
-
134
-
135
-
136
-
137
-
138
-
139
-
140
-
141
-
142
-
143
-
144
-
145
-
146
-
147
-
148
-
149
-
150
-
151
-
152
-
153
-
154
-
155
-
156
-
157
-
158
-
159
-
160
-
161
-
162
-
163
-
164
-
165
-
166
-
167
-
168
-
169
-
170
-
171
-
172
-
173
-
174
-
175
-
176
-
177
-
178
-
179
-
180
-
181
-
182
-
183
-
184
-
185
-
186
-
187
-
188
-
189
-
190
-
191
-
192
-
193
-
194
-
195
-
196
-
197
-
198
-
199
-
200
-
201
-
202
-
203
-
204
-
205
-
206
-
207
-
208
-
209
-
210
-
211
-
212
-
213
-
214
-
215
-
216
 |
 |
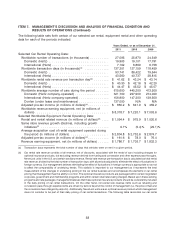
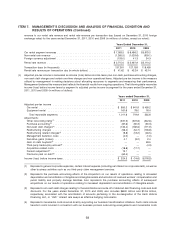
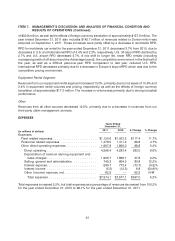
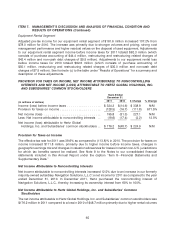
ITEM 7. MANAGEMENT’S DISCUSSION AND ANALYSIS OF FINANCIAL CONDITION AND
RESULTS OF OPERATIONS (Continued)
$30.2 million, concession fees of $27.4 million, charge card fees of $13.8 million and reservation
costs of $5.2 million primarily related to improved car rental volume demand.
Equipment Rental Segment
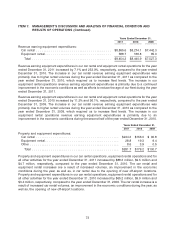
Direct operating expenses for our equipment rental segment of $677.3 million in 2010 increased 2.1%
from $663.4 million in 2010 as a result of increases in fleet related expenses and personnel related
expenses, partly offset by a decrease in other direct operating expenses.
Fleet related expenses for our equipment rental segment of $180.8 million in 2010 increased
$24.4 million, or 15.6% from 2009. Equipment maintenance costs and freight costs increased by
$13.7 million and $9.0 million, respectively, relating to efforts to maximize the use of our existing
fleet.
Personnel related expenses for our equipment rental segment of $209.8 million in 2010 increased
$4.1 million, or 2.0% from 2009. The increase was related to increases in incentives of $3.1 million
primarily related to improved results, as well as the effects of foreign currency translation of
approximately $2.7 million. The increase was partly offset by a decrease in salaries and related
expenses of $1.7 million primarily related to restructuring.
Other direct operating expenses for our equipment rental segment of $286.7 million in 2010
decreased $14.6 million, or 4.8% from 2009. The decrease was primarily related to decreases in
equipment rental cost of goods sold of $10.9 million, credit and collections expense of $7.3 million,
facilities expenses of $3.9 million and field systems of $3.0 million, partly offset by the effects of
foreign currency translation of approximately $4.6 million and an increase in re-rent expense of
$2.3 million. The decreases were primarily a result of disciplined cost management and reductions
in equipment rental volume.
Depreciation of Revenue Earning Equipment and Lease Charges
Car Rental Segment
Depreciation of revenue earning equipment and lease charges for our car rental segment of
$1,594.6 million for the year ended December 31, 2010 decreased 1.4% from $1,616.6 million for the
year ended December 31, 2009. The decrease was primarily due to an improvement in certain vehicle
residual values and a change in mix of vehicles, partly offset by the effects of foreign currency translation
of approximately $9.2 million.
Equipment Rental Segment
Depreciation of revenue earning equipment and lease charges in our equipment rental segment of
$273.5 million for the year ended December 31, 2010 decreased 13.8% from $317.2 million for the year
ended December 31, 2009. The decrease was primarily due to a 4.9% reduction in average acquisition
cost of rental equipment operated during the period and higher residual values on the disposal of used
equipment.
Selling, General and Administrative Expenses
Selling, general and administrative expenses increased 3.5%, due to increases in advertising, sales
promotion expenses and administrative expenses.
Advertising expenses increased $20.7 million, or 18.3%, primarily due to a new television campaign
in the U.S., as well as, a reduction in advertising funding received from third parties.
68