Hertz 2011 Annual Report Download - page 165
Download and view the complete annual report
Please find page 165 of the 2011 Hertz annual report below. You can navigate through the pages in the report by either clicking on the pages listed below, or by using the keyword search tool below to find specific information within the annual report.-
 1
1 -
2
-
3
-
4
-
5
-
6
-
7
-
8
-
9
-
10
-
11
-
12
-
13
-
14
-
15
-
16
-
17
-
18
-
19
-
20
-
21
-
22
-
23
-
24
-
25
-
26
-
27
-
28
-
29
-
30
-
31
-
32
-
33
-
34
-
35
-
36
-
37
-
38
-
39
-
40
-
41
-
42
-
43
-
44
-
45
-
46
-
47
-
48
-
49
-
50
-
51
-
52
-
53
-
54
-
55
-
56
-
57
-
58
-
59
-
60
-
61
-
62
-
63
-
64
-
65
-
66
-
67
-
68
-
69
-
70
-
71
-
72
-
73
-
74
-
75
-
76
-
77
-
78
-
79
-
80
-
81
-
82
-
83
-
84
-
85
-
86
-
87
-
88
-
89
-
90
-
91
-
92
-
93
-
94
-
95
-
96
-
97
-
98
-
99
-
100
-
101
-
102
-
103
-
104
-
105
-
106
-
107
-
108
-
109
-
110
-
111
-
112
-
113
-
114
-
115
-
116
-
117
-
118
-
119
-
120
-
121
-
122
-
123
-
124
-
125
-
126
-
127
-
128
-
129
-
130
-
131
-
132
-
133
-
134
-
135
-
136
-
137
-
138
-
139
-
140
-
141
-
142
-
143
-
144
-
145
-
146
-
147
-
148
-
149
-
150
-
151
-
152
-
153
-
154
-
 155
155 -
 156
156 -
 157
157 -
 158
158 -
 159
159 -
 160
160 -
 161
161 -
 162
162 -
 163
163 -
 164
164 -
 165
165 -
 166
166 -
 167
167 -
 168
168 -
 169
169 -
 170
170 -
 171
171 -
 172
172 -
 173
173 -
 174
174 -
 175
175 -
176
-
177
-
178
-
179
-
180
-
181
-
182
-
183
-
184
-
185
-
186
-
187
-
188
-
189
-
190
-
191
-
192
-
193
-
194
-
195
-
196
-
197
-
198
-
199
-
200
-
201
-
202
-
203
-
204
-
205
-
206
-
207
-
208
-
209
-
210
-
211
-
212
-
213
-
214
-
215
-
216
 |
 |

HERTZ GLOBAL HOLDINGS, INC. AND SUBSIDIARIES
NOTES TO CONSOLIDATED FINANCIAL STATEMENTS (Continued)
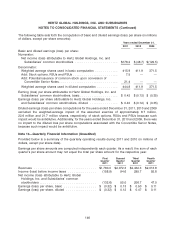
Years ended December 31,
2011 2010 2009
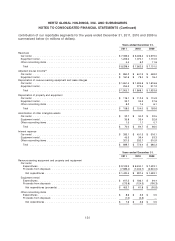
By Segment:
Car rental ............................................... $16.6 $18.1 $ 58.7
Equipment rental .......................................... 40.5 34.7 38.2
Other reconciling items ..................................... (0.7) 1.9 9.9
Total ................................................. $56.4 $54.7 $106.8
During the years ended December 31, 2011, 2010 and 2009, the after-tax effect of the restructuring
charges decreased earnings per share by $0.09 and increased the loss per share by $0.09 and $0.23,
respectively.
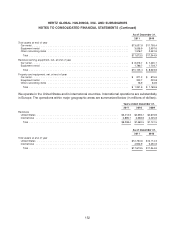
The following table sets forth the activity affecting the restructuring accrual during the years ended
December 31, 2011 and 2010 (in millions of dollars). We expect to pay the remaining restructuring
obligations relating to involuntary termination benefits over the next twelve months. The remainder of the
restructuring accrual relates to future lease obligations which will be paid over the remaining term of the
applicable leases.
Pension
Involuntary and Post
Termination Retirement Consultant
Benefits Expense Costs Other Total
Balance as of January 1, 2010 ............ $19.6 $ — $ 0.4 $ 9.7 $ 29.7
Charges incurred .................... 12.2 0.4 1.1 41.0 54.7
Cash payments ..................... (23.5) — (1.5) (12.4) (37.4)
Other(1) ........................... (2.0) (0.2) 0.1 (27.4) (29.5)
Balance as of December 31, 2010 ......... 6.3 0.2 0.1 10.9 17.5
Charges incurred .................... 14.4 0.4 1.3 40.3 56.4
Cash payments ..................... (15.5) — (0.6) (2.3) (18.4)
Other(2) ........................... 3.9 (0.4) (0.2) (37.2) (33.9)
Balance as of December 31, 2011 ......... $ 9.1 $0.2 $0.6 $11.7 $ 21.6
(1) Consists of decreases of $20.4 million for asset writedowns, $6.5 million for facility closures, $1.6 million loss in foreign
currency translation, $0.9 million in involuntary benefits and $0.2 million for executive pension liability settlements, partly
offset by an increase in consultant costs of $0.1 million.
(2) Consists of decreases of $23.2 million for asset writedowns, $13.9 million for facility closures, $0.4 million FAS 88 pension
adjustment and $0.2 million of consultant costs, partly offset by a $3.8 million increase for involuntary benefits.
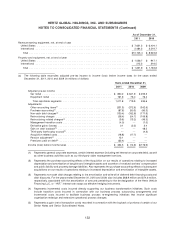
Note 13—Financial Instruments
Financial instruments, which potentially subject us to concentrations of credit risk, consist principally of
cash equivalents, short-term investments and trade receivables. We place our cash equivalents and
short-term investments with a number of financial institutions and investment funds to limit the amount of
credit exposure to any one financial institution. Concentrations of credit risk with respect to trade
receivables are limited due to the large number of customers comprising our customer base, and their
dispersion across different businesses and geographic areas. As of December 31, 2011, we had no
significant concentration of credit risk.
GAAP establishes a three-tier value hierarchy, which prioritizes the inputs used in measuring fair value as
follows: (Level 1) observable inputs such as quoted prices in active markets; (Level 2) inputs other than
139