Hertz 2011 Annual Report Download - page 151
Download and view the complete annual report
Please find page 151 of the 2011 Hertz annual report below. You can navigate through the pages in the report by either clicking on the pages listed below, or by using the keyword search tool below to find specific information within the annual report.-
 1
1 -
2
-
3
-
4
-
5
-
6
-
7
-
8
-
9
-
10
-
11
-
12
-
13
-
14
-
15
-
16
-
17
-
18
-
19
-
20
-
21
-
22
-
23
-
24
-
25
-
26
-
27
-
28
-
29
-
30
-
31
-
32
-
33
-
34
-
35
-
36
-
37
-
38
-
39
-
40
-
41
-
42
-
43
-
44
-
45
-
46
-
47
-
48
-
49
-
50
-
51
-
52
-
53
-
54
-
55
-
56
-
57
-
58
-
59
-
60
-
61
-
62
-
63
-
64
-
65
-
66
-
67
-
68
-
69
-
70
-
71
-
72
-
73
-
74
-
75
-
76
-
77
-
78
-
79
-
80
-
81
-
82
-
83
-
84
-
85
-
86
-
87
-
88
-
89
-
90
-
91
-
92
-
93
-
94
-
95
-
96
-
97
-
98
-
99
-
100
-
101
-
102
-
103
-
104
-
105
-
106
-
107
-
108
-
109
-
110
-
111
-
112
-
113
-
114
-
115
-
116
-
117
-
118
-
119
-
120
-
121
-
122
-
123
-
124
-
125
-
126
-
127
-
128
-
129
-
130
-
131
-
132
-
133
-
134
-
135
-
136
-
137
-
138
-
139
-
140
-
 141
141 -
 142
142 -
 143
143 -
 144
144 -
 145
145 -
 146
146 -
 147
147 -
 148
148 -
 149
149 -
 150
150 -
 151
151 -
 152
152 -
 153
153 -
 154
154 -
 155
155 -
 156
156 -
 157
157 -
 158
158 -
 159
159 -
 160
160 -
 161
161 -
162
-
163
-
164
-
165
-
166
-
167
-
168
-
169
-
170
-
171
-
172
-
173
-
174
-
175
-
176
-
177
-
178
-
179
-
180
-
181
-
182
-
183
-
184
-
185
-
186
-
187
-
188
-
189
-
190
-
191
-
192
-
193
-
194
-
195
-
196
-
197
-
198
-
199
-
200
-
201
-
202
-
203
-
204
-
205
-
206
-
207
-
208
-
209
-
210
-
211
-
212
-
213
-
214
-
215
-
216
 |
 |

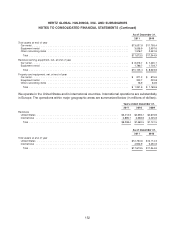
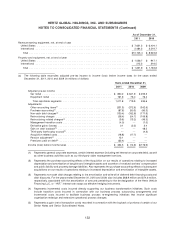
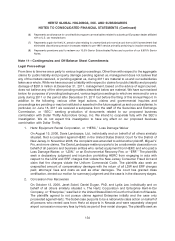
HERTZ GLOBAL HOLDINGS, INC. AND SUBSIDIARIES
NOTES TO CONSOLIDATED FINANCIAL STATEMENTS (Continued)
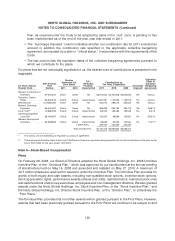
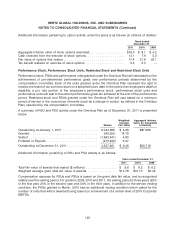
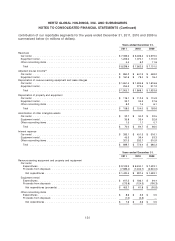
Note 7—Depreciation of Revenue Earning Equipment and Lease Charges
Depreciation of revenue earning equipment and lease charges includes the following (in millions of
dollars):
Years ended December 31,
2011 2010 2009
Depreciation of revenue earning equipment ................. $1,921.8 $1,747.0 $1,780.1
Adjustment of depreciation upon disposal of the equipment ..... (112.2) 42.9 72.0
Rents paid for vehicles leased ........................... 96.1 78.2 81.7
Total ............................................ $1,905.7 $1,868.1 $1,933.8
The adjustment of depreciation upon disposal of revenue earning equipment for the years ended
December 31, 2011, 2010 and 2009 included (in millions of dollars) net gain of $13.3 million, net losses
of $10.0 and $40.7, respectively, on the disposal of industrial and construction equipment used in our
equipment rental operations, and net gain of $98.9 million, net losses of $32.9 and $31.3, respectively,
on the disposal of vehicles used in our car rental operations.
Depreciation rates are reviewed on a quarterly basis based on management’s routine review of present
and estimated future market conditions and their effect on residual values at the time of disposal. During
2011, 2010 and 2009, depreciation rates being used to compute the provision for depreciation of
revenue earning equipment were adjusted on certain vehicles in our car rental operations to reflect
changes in the estimated residual values to be realized when revenue earning equipment is sold. These
depreciation rate changes resulted in a net decrease of $13.8 million and increases of $19.1 million and
$13.2 million in depreciation expense for the years ended December 31, 2011, 2010 and 2009,
respectively. Depreciation rate changes in certain of our equipment rental operations resulted in a
decrease of $4.4 million and increases of $3.6 million and $6.1 million in depreciation expense for the
years ended December 31, 2011, 2010 and 2009, respectively.
For the years ended December 31, 2011, 2010 and 2009, our worldwide car rental operations sold
approximately 164,100, 159,000 and 153,300 non-program cars, respectively, a 3.2% increase in 2011
versus 2010 primarily due to a higher average fleet size.
Note 8—Taxes on Income
The components of income (loss) before income taxes for the periods were as follows (in millions of
dollars):
Years ended December 31,
2011 2010 2009
Domestic ................................ $186.3 $(128.1) $(154.0)
Foreign ................................. 138.0 113.5 (22.9)
Total .................................. $324.3 $ (14.6) $(176.9)
125