Hertz 2011 Annual Report Download - page 112
Download and view the complete annual report
Please find page 112 of the 2011 Hertz annual report below. You can navigate through the pages in the report by either clicking on the pages listed below, or by using the keyword search tool below to find specific information within the annual report.-
 1
1 -
2
-
3
-
4
-
5
-
6
-
7
-
8
-
9
-
10
-
11
-
12
-
13
-
14
-
15
-
16
-
17
-
18
-
19
-
20
-
21
-
22
-
23
-
24
-
25
-
26
-
27
-
28
-
29
-
30
-
31
-
32
-
33
-
34
-
35
-
36
-
37
-
38
-
39
-
40
-
41
-
42
-
43
-
44
-
45
-
46
-
47
-
48
-
49
-
50
-
51
-
52
-
53
-
54
-
55
-
56
-
57
-
58
-
59
-
60
-
61
-
62
-
63
-
64
-
65
-
66
-
67
-
68
-
69
-
70
-
71
-
72
-
73
-
74
-
75
-
76
-
77
-
78
-
79
-
80
-
81
-
82
-
83
-
84
-
85
-
86
-
87
-
88
-
89
-
90
-
91
-
92
-
93
-
94
-
95
-
96
-
97
-
98
-
99
-
100
-
101
-
 102
102 -
 103
103 -
 104
104 -
 105
105 -
 106
106 -
 107
107 -
 108
108 -
 109
109 -
 110
110 -
 111
111 -
 112
112 -
 113
113 -
 114
114 -
 115
115 -
 116
116 -
 117
117 -
 118
118 -
 119
119 -
 120
120 -
 121
121 -
 122
122 -
123
-
124
-
125
-
126
-
127
-
128
-
129
-
130
-
131
-
132
-
133
-
134
-
135
-
136
-
137
-
138
-
139
-
140
-
141
-
142
-
143
-
144
-
145
-
146
-
147
-
148
-
149
-
150
-
151
-
152
-
153
-
154
-
155
-
156
-
157
-
158
-
159
-
160
-
161
-
162
-
163
-
164
-
165
-
166
-
167
-
168
-
169
-
170
-
171
-
172
-
173
-
174
-
175
-
176
-
177
-
178
-
179
-
180
-
181
-
182
-
183
-
184
-
185
-
186
-
187
-
188
-
189
-
190
-
191
-
192
-
193
-
194
-
195
-
196
-
197
-
198
-
199
-
200
-
201
-
202
-
203
-
204
-
205
-
206
-
207
-
208
-
209
-
210
-
211
-
212
-
213
-
214
-
215
-
216
 |
 |

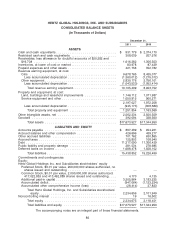
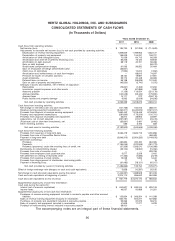
HERTZ GLOBAL HOLDINGS, INC. AND SUBSIDIARIES
CONSOLIDATED BALANCE SHEETS
(In Thousands of Dollars)
December 31,
2011 2010
ASSETS
Cash and cash equivalents ................................ $ 931,779 $ 2,374,170
Restricted cash and cash equivalents ........................ 308,039 207,576
Receivables, less allowance for doubtful accounts of $20,282 and
$19,708 ............................................ 1,616,382 1,356,553
Inventories, at lower of cost or market ........................ 83,978 87,429
Prepaid expenses and other assets .......................... 421,758 352,782
Revenue earning equipment, at cost:
Cars .............................................. 9,678,765 8,435,077
Less accumulated depreciation .......................... (1,360,012) (1,215,012)
Other equipment ...................................... 2,830,176 2,756,101
Less accumulated depreciation .......................... (1,043,520) (1,052,414)
Total revenue earning equipment ....................... 10,105,409 8,923,752
Property and equipment, at cost:
Land, buildings and leasehold improvements ................. 1,146,112 1,071,987
Service equipment and other ............................. 1,050,915 900,271
2,197,027 1,972,258
Less accumulated depreciation .......................... (945,173) (808,689)
Total property and equipment ......................... 1,251,854 1,163,569
Other intangible assets, net ............................... 2,562,234 2,550,559
Goodwill ............................................. 392,094 328,560
Total assets ...................................... $17,673,527 $17,344,950
LIABILITIES AND EQUITY
Accounts payable ...................................... $ 897,489 $ 954,261
Accrued salaries and other compensation ..................... 426,696 439,217
Other accrued liabilities .................................. 701,762 630,865
Accrued taxes ......................................... 125,803 108,940
Debt ................................................ 11,317,090 11,306,429
Public liability and property damage ......................... 281,534 278,685
Deferred taxes on income ................................. 1,688,478 1,508,102
Total liabilities ..................................... 15,438,852 15,226,499
Commitments and contingencies
Equity:
Hertz Global Holdings Inc. and Subsidiaries stockholders’ equity
Preferred Stock, $0.01 par value, 200,000,000 shares authorized, no
shares issued and outstanding .......................... — —
Common Stock, $0.01 par value, 2,000,000,000 shares authorized,
417,022,853 and 413,462,889 shares issued and outstanding .... 4,170 4,135
Additional paid-in capital ................................ 3,205,964 3,183,225
Accumulated deficit .................................... (947,064) (1,123,234)
Accumulated other comprehensive income (loss) .............. (28,414) 37,823
Total Hertz Global Holdings, Inc. and Subsidiaries stockholders’
equity ......................................... 2,234,656 2,101,949
Noncontrolling interest ................................... 19 16,502
Total equity ...................................... 2,234,675 2,118,451
Total liabilities and equity ............................ $17,673,527 $17,344,950
The accompanying notes are an integral part of these financial statements.
86