Hertz 2011 Annual Report Download - page 148
Download and view the complete annual report
Please find page 148 of the 2011 Hertz annual report below. You can navigate through the pages in the report by either clicking on the pages listed below, or by using the keyword search tool below to find specific information within the annual report.-
 1
1 -
2
-
3
-
4
-
5
-
6
-
7
-
8
-
9
-
10
-
11
-
12
-
13
-
14
-
15
-
16
-
17
-
18
-
19
-
20
-
21
-
22
-
23
-
24
-
25
-
26
-
27
-
28
-
29
-
30
-
31
-
32
-
33
-
34
-
35
-
36
-
37
-
38
-
39
-
40
-
41
-
42
-
43
-
44
-
45
-
46
-
47
-
48
-
49
-
50
-
51
-
52
-
53
-
54
-
55
-
56
-
57
-
58
-
59
-
60
-
61
-
62
-
63
-
64
-
65
-
66
-
67
-
68
-
69
-
70
-
71
-
72
-
73
-
74
-
75
-
76
-
77
-
78
-
79
-
80
-
81
-
82
-
83
-
84
-
85
-
86
-
87
-
88
-
89
-
90
-
91
-
92
-
93
-
94
-
95
-
96
-
97
-
98
-
99
-
100
-
101
-
102
-
103
-
104
-
105
-
106
-
107
-
108
-
109
-
110
-
111
-
112
-
113
-
114
-
115
-
116
-
117
-
118
-
119
-
120
-
121
-
122
-
123
-
124
-
125
-
126
-
127
-
128
-
129
-
130
-
131
-
132
-
133
-
134
-
135
-
136
-
137
-
 138
138 -
 139
139 -
 140
140 -
 141
141 -
 142
142 -
 143
143 -
 144
144 -
 145
145 -
 146
146 -
 147
147 -
 148
148 -
 149
149 -
 150
150 -
 151
151 -
 152
152 -
 153
153 -
 154
154 -
 155
155 -
 156
156 -
 157
157 -
 158
158 -
159
-
160
-
161
-
162
-
163
-
164
-
165
-
166
-
167
-
168
-
169
-
170
-
171
-
172
-
173
-
174
-
175
-
176
-
177
-
178
-
179
-
180
-
181
-
182
-
183
-
184
-
185
-
186
-
187
-
188
-
189
-
190
-
191
-
192
-
193
-
194
-
195
-
196
-
197
-
198
-
199
-
200
-
201
-
202
-
203
-
204
-
205
-
206
-
207
-
208
-
209
-
210
-
211
-
212
-
213
-
214
-
215
-
216
 |
 |

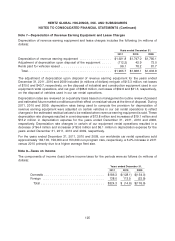
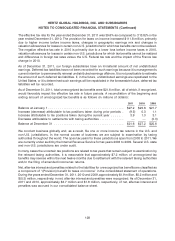
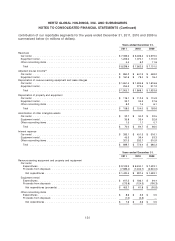
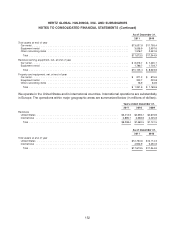
HERTZ GLOBAL HOLDINGS, INC. AND SUBSIDIARIES
NOTES TO CONSOLIDATED FINANCIAL STATEMENTS (Continued)
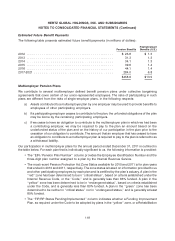
substituting the historical volatility of an appropriate industry sector index for the expected volatility of our
common stock price as an assumption in the valuation model. We selected the Dow Jones Specialized
Consumer Services sub-sector within the consumer services industry, and we used the U.S. large
capitalization component, which includes the top 70% of the index universe (by market value).
The calculation of the historical volatility of the index was made using the daily historical closing values of
the index for the preceding 6.25 years, because that is the expected term of the options using the
simplified approach.
The risk-free interest rate is the implied zero-coupon yield for U.S. Treasury securities having a maturity
approximately equal to the expected term, as of the grant dates. The assumed dividend yield is zero.
Assumption 2011 Grants 2010 Grants 2009 Grants
Expected volatility ......................... 36.7% 36.1% 34.9%
Expected dividend yield .................... 0.0% 0.0% 0.0%
Expected term (years) ...................... 6.25 6.25 6.25
Risk-free interest rate ....................... 2.56% 1.62%-2.96% 2.90%
Weighted-average grant date fair value .......... $5.93 $4.00 $1.29
A summary of option activity under the Stock Incentive Plan and the Omnibus Plan as of December 31,
2011 is presented below.
Weighted-
Weighted- Average
Average Remaining Aggregate Intrinsic
Exercise Contractual Value (In thousands
Options Shares Price Term (years) of dollars)
Outstanding at January 1, 2011 ........ 15,415,904 $ 9.69 6.7 $84,534
Granted ......................... 2,108,944 14.60
Exercised ........................ (1,808,272) 7.20
Forfeited or Expired ................. (574,515) 11.65
Outstanding at December 31, 2011 ...... 15,142,061 10.60 6.3 $41,110
Exercisable at December 31, 2011 ...... 10,226,236 9.91 5.3 $36,136
A summary of non-vested options as of December 31, 2011, and changes during the year, is presented
below.
Weighted-
Weighted- Average Grant-
Non-vested Average Date Fair
Shares Exercise Price Value
Non-vested as of January 1, 2011 ................. 6,347,726 $ 9.61 $4.91
Granted .................................... 2,108,944 14.60 5.93
Vested ..................................... (3,027,297) 9.14 5.76
Forfeited ................................... (513,548) 9.58 4.60
Non-vested as of December 31, 2011 .............. 4,915,825 $12.04 $4.86
122