Hertz 2011 Annual Report Download - page 36
Download and view the complete annual report
Please find page 36 of the 2011 Hertz annual report below. You can navigate through the pages in the report by either clicking on the pages listed below, or by using the keyword search tool below to find specific information within the annual report.-
 1
1 -
2
-
3
-
4
-
5
-
6
-
7
-
8
-
9
-
10
-
11
-
12
-
13
-
14
-
15
-
16
-
17
-
18
-
19
-
20
-
21
-
22
-
23
-
24
-
25
-
 26
26 -
 27
27 -
 28
28 -
 29
29 -
 30
30 -
 31
31 -
 32
32 -
 33
33 -
 34
34 -
 35
35 -
 36
36 -
 37
37 -
 38
38 -
 39
39 -
 40
40 -
 41
41 -
 42
42 -
 43
43 -
 44
44 -
 45
45 -
 46
46 -
47
-
48
-
49
-
50
-
51
-
52
-
53
-
54
-
55
-
56
-
57
-
58
-
59
-
60
-
61
-
62
-
63
-
64
-
65
-
66
-
67
-
68
-
69
-
70
-
71
-
72
-
73
-
74
-
75
-
76
-
77
-
78
-
79
-
80
-
81
-
82
-
83
-
84
-
85
-
86
-
87
-
88
-
89
-
90
-
91
-
92
-
93
-
94
-
95
-
96
-
97
-
98
-
99
-
100
-
101
-
102
-
103
-
104
-
105
-
106
-
107
-
108
-
109
-
110
-
111
-
112
-
113
-
114
-
115
-
116
-
117
-
118
-
119
-
120
-
121
-
122
-
123
-
124
-
125
-
126
-
127
-
128
-
129
-
130
-
131
-
132
-
133
-
134
-
135
-
136
-
137
-
138
-
139
-
140
-
141
-
142
-
143
-
144
-
145
-
146
-
147
-
148
-
149
-
150
-
151
-
152
-
153
-
154
-
155
-
156
-
157
-
158
-
159
-
160
-
161
-
162
-
163
-
164
-
165
-
166
-
167
-
168
-
169
-
170
-
171
-
172
-
173
-
174
-
175
-
176
-
177
-
178
-
179
-
180
-
181
-
182
-
183
-
184
-
185
-
186
-
187
-
188
-
189
-
190
-
191
-
192
-
193
-
194
-
195
-
196
-
197
-
198
-
199
-
200
-
201
-
202
-
203
-
204
-
205
-
206
-
207
-
208
-
209
-
210
-
211
-
212
-
213
-
214
-
215
-
216
 |
 |

ITEM 1. BUSINESS (Continued)
market share for airport rentals, we intend to seek profitable growth in the off-airport rental market, both
in the United States and internationally.
Since January 1, 2009, we increased the number of our off-airport rental locations in the United States by
approximately 32% to 2,175 locations. Our strategy includes selected openings of new off-airport
locations, the disciplined evaluation of existing locations and the pursuit of same-store sales growth. We
anticipate that same-store sales growth will be driven by our traditional leisure and business traveler
customers and by increasing penetration of the insurance replacement market, of which we currently
have a low market share. In the United States during the year ended December 31, 2011, approximately
one-third of our rental revenues at off-airport locations were related to replacement rentals. We believe
that if we successfully pursue our strategy of profitable off-airport growth, the proportion of replacement
rental revenues will increase. As we move forward, our determination of whether to continue to expand
our U.S. off-airport network will be based upon a combination of factors, including, commercial activity
and potential profitability as well as the concentration of target insurance company policyholders, car
dealerships and auto body shops. We also intend to increase the number of our staffed off-airport rental
locations internationally based on similar criteria.
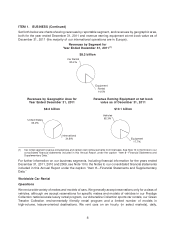
Our worldwide car rental segment generated $7,083.5 million in revenues during the year ended
December 31, 2011.
Customers and Business Mix
We categorize our car rental business based on two primary criteria—the purpose for which customers
rent from us (business or leisure) and the type of location from which they rent (airport or off-airport). The
table below sets forth, for the year ended December 31, 2011, the percentages of rental revenues and
rental transactions in our U.S. and international operations derived from business and leisure rentals and
from airport and off-airport rentals.
Year ended December 31, 2011
U.S. International
Revenues Transactions Revenues Transactions
Type of Car Rental
By Customer:
Business .............................. 43% 48% 54% 55%
Leisure ............................... 57 52 46 45
100% 100% 100% 100%
By Location:
Airport ............................... 70% 73% 56% 59%
Off-airport ............................. 30 27 44 41
100% 100% 100% 100%
10