Hertz 2011 Annual Report Download - page 76
Download and view the complete annual report
Please find page 76 of the 2011 Hertz annual report below. You can navigate through the pages in the report by either clicking on the pages listed below, or by using the keyword search tool below to find specific information within the annual report.-
 1
1 -
2
-
3
-
4
-
5
-
6
-
7
-
8
-
9
-
10
-
11
-
12
-
13
-
14
-
15
-
16
-
17
-
18
-
19
-
20
-
21
-
22
-
23
-
24
-
25
-
26
-
27
-
28
-
29
-
30
-
31
-
32
-
33
-
34
-
35
-
36
-
37
-
38
-
39
-
40
-
41
-
42
-
43
-
44
-
45
-
46
-
47
-
48
-
49
-
50
-
51
-
52
-
53
-
54
-
55
-
56
-
57
-
58
-
59
-
60
-
61
-
62
-
63
-
64
-
65
-
 66
66 -
 67
67 -
 68
68 -
 69
69 -
 70
70 -
 71
71 -
 72
72 -
 73
73 -
 74
74 -
 75
75 -
 76
76 -
 77
77 -
 78
78 -
 79
79 -
 80
80 -
 81
81 -
 82
82 -
 83
83 -
 84
84 -
 85
85 -
 86
86 -
87
-
88
-
89
-
90
-
91
-
92
-
93
-
94
-
95
-
96
-
97
-
98
-
99
-
100
-
101
-
102
-
103
-
104
-
105
-
106
-
107
-
108
-
109
-
110
-
111
-
112
-
113
-
114
-
115
-
116
-
117
-
118
-
119
-
120
-
121
-
122
-
123
-
124
-
125
-
126
-
127
-
128
-
129
-
130
-
131
-
132
-
133
-
134
-
135
-
136
-
137
-
138
-
139
-
140
-
141
-
142
-
143
-
144
-
145
-
146
-
147
-
148
-
149
-
150
-
151
-
152
-
153
-
154
-
155
-
156
-
157
-
158
-
159
-
160
-
161
-
162
-
163
-
164
-
165
-
166
-
167
-
168
-
169
-
170
-
171
-
172
-
173
-
174
-
175
-
176
-
177
-
178
-
179
-
180
-
181
-
182
-
183
-
184
-
185
-
186
-
187
-
188
-
189
-
190
-
191
-
192
-
193
-
194
-
195
-
196
-
197
-
198
-
199
-
200
-
201
-
202
-
203
-
204
-
205
-
206
-
207
-
208
-
209
-
210
-
211
-
212
-
213
-
214
-
215
-
216
 |
 |
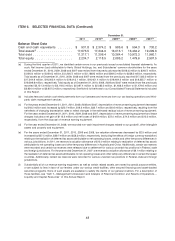
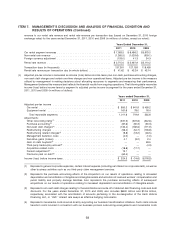
ITEM 7. MANAGEMENT’S DISCUSSION AND ANALYSIS OF FINANCIAL CONDITION AND
RESULTS OF OPERATIONS (Continued)
equipment, and consequently we require substantial liquidity to finance such expenditures. See
‘‘Liquidity and Capital Resources’’ below.
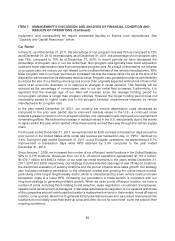
Car Rental
In the U.S., as of December 31, 2011, the percentage of non-program cars was 79% as compared to 72%
as of December 31, 2010. Internationally, as of December 31, 2011, the percentage of non-program cars
was 75%, compared to 70% as of December 31, 2010. In recent periods we have decreased the
percentage of program cars in our car rental fleet. Non-program cars typically have lower acquisition
costs and lower depreciation rates than comparable program cars. As a result of decreasing our reliance
on program cars, we reduce our risk related to the creditworthiness of the vehicle manufacturers. With
fewer program cars in our fleet, we have an increased risk that the market value of a car at the time of its
disposition will be less than its estimated residual value. Program cars generally provide us with flexibility
to reduce the size of our fleet by returning cars sooner than originally expected without risk of loss in the
event of an economic downturn or to respond to changes in rental demand. This flexibility will be
reduced as the percentage of non-program cars in our car rental fleet increases. Furthermore, it is
expected that the average age of our fleet will increase since the average holding period for
non-program vehicles is longer than program vehicles. However, the longer holding period does not
necessarily equate to higher costs due to the stringent turnback requirements imposed by vehicle
manufacturers for program cars.
In the year ended December 31, 2011, our monthly per vehicle depreciation costs decreased as
compared to the prior year period due to improved residual values in the U.S., a continued move
towards a greater proportion of non-program vehicles, mix optimization and improved procurement and
remarketing efforts. We believe the increase in residual values in the U.S. was partially due to the events
in Japan earlier this year which leveled off as these events worked their way through the vehicle supply
chain.
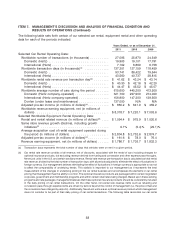
For the year ended December 31, 2011, we experienced an 8.5% increase in transaction days versus the
prior period in the United States while rental rate revenue per transaction day, or ‘‘RPD,’’ declined by
4.4%. During the year ended December 31, 2011, in our European operations, we experienced a 5.7%
improvement in transaction days while RPD declined by 3.0% compared to the year ended
December 31, 2010.
Since January 1, 2009, we increased the number of our off-airport rental locations in the United States by
32% to 2,175 locations. Revenues from our U.S. off-airport operations represented $1,197.4 million,
$1,079.7 million and $953.4 million of our total car rental revenues in the years ended December 31,
2011, 2010 and 2009, respectively. Our strategy includes selected openings of new off-airport locations,
the disciplined evaluation of existing locations and the pursuit of same-store sales growth. Our strategy
also includes increasing penetration in the off-airport market and growing the online leisure market,
particularly in the longer length weekly sector, which is characterized by lower vehicle costs and lower
transaction costs at a lower RPD. Increasing our penetration in these sectors is consistent with our
long-term strategy to generate profitable growth. When we open a new off-airport location, we incur a
number of costs, including those relating to site selection, lease negotiation, recruitment of employees,
selection and development of managers, initial sales activities and integration of our systems with those
of the companies who will reimburse the location’s replacement renters for their rentals. A new off-airport
location, once opened, takes time to generate its full potential revenues and, as a result, revenues at new
locations do not initially cover their start-up costs and often do not, for some time, cover the costs of their
ongoing operations.
50