Hertz 2011 Annual Report Download - page 149
Download and view the complete annual report
Please find page 149 of the 2011 Hertz annual report below. You can navigate through the pages in the report by either clicking on the pages listed below, or by using the keyword search tool below to find specific information within the annual report.-
 1
1 -
2
-
3
-
4
-
5
-
6
-
7
-
8
-
9
-
10
-
11
-
12
-
13
-
14
-
15
-
16
-
17
-
18
-
19
-
20
-
21
-
22
-
23
-
24
-
25
-
26
-
27
-
28
-
29
-
30
-
31
-
32
-
33
-
34
-
35
-
36
-
37
-
38
-
39
-
40
-
41
-
42
-
43
-
44
-
45
-
46
-
47
-
48
-
49
-
50
-
51
-
52
-
53
-
54
-
55
-
56
-
57
-
58
-
59
-
60
-
61
-
62
-
63
-
64
-
65
-
66
-
67
-
68
-
69
-
70
-
71
-
72
-
73
-
74
-
75
-
76
-
77
-
78
-
79
-
80
-
81
-
82
-
83
-
84
-
85
-
86
-
87
-
88
-
89
-
90
-
91
-
92
-
93
-
94
-
95
-
96
-
97
-
98
-
99
-
100
-
101
-
102
-
103
-
104
-
105
-
106
-
107
-
108
-
109
-
110
-
111
-
112
-
113
-
114
-
115
-
116
-
117
-
118
-
119
-
120
-
121
-
122
-
123
-
124
-
125
-
126
-
127
-
128
-
129
-
130
-
131
-
132
-
133
-
134
-
135
-
136
-
137
-
138
-
 139
139 -
 140
140 -
 141
141 -
 142
142 -
 143
143 -
 144
144 -
 145
145 -
 146
146 -
 147
147 -
 148
148 -
 149
149 -
 150
150 -
 151
151 -
 152
152 -
 153
153 -
 154
154 -
 155
155 -
 156
156 -
 157
157 -
 158
158 -
 159
159 -
160
-
161
-
162
-
163
-
164
-
165
-
166
-
167
-
168
-
169
-
170
-
171
-
172
-
173
-
174
-
175
-
176
-
177
-
178
-
179
-
180
-
181
-
182
-
183
-
184
-
185
-
186
-
187
-
188
-
189
-
190
-
191
-
192
-
193
-
194
-
195
-
196
-
197
-
198
-
199
-
200
-
201
-
202
-
203
-
204
-
205
-
206
-
207
-
208
-
209
-
210
-
211
-
212
-
213
-
214
-
215
-
216
 |
 |

HERTZ GLOBAL HOLDINGS, INC. AND SUBSIDIARIES
NOTES TO CONSOLIDATED FINANCIAL STATEMENTS (Continued)
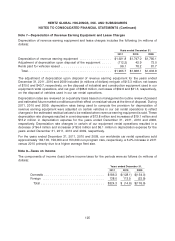
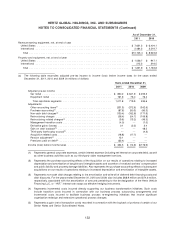
Additional information pertaining to option activity under the plans is as follows (in millions of dollars):
Years ended
December 31,
2011 2010 2009
Aggregate intrinsic value of stock options exercised .................. $15.0 $ 8.1 $ 4.2
Cash received from the exercise of stock options .................... 13.1 7.9 5.3
Fair value of options that vested ................................ 17.4 21.6 23.1
Tax benefit realized on exercise of stock options .................... 0.5 0.3 —
Performance Stock, Performance Stock Units, Restricted Stock and Restricted Stock Units
Performance stock, PSUs and performance units granted under the Omnibus Plan will vest based on the
achievement of pre-determined performance goals over performance periods determined by the
compensation committee. Each of the units granted under the Omnibus Plan represent the right to
receive one share of our common stock on a specified future date. In the event of an employee’s death or
disability, a pro rata portion of the employee’s performance stock, performance stock units and
performance units will vest to the extent performance goals are achieved at the end of the performance
period. Restricted stock and RSUs granted under the Omnibus Plan will vest based on a minimum
period of service or the occurrence of events (such as a change in control, as defined in the Omnibus
Plan) specified by the compensation committee.
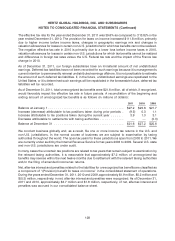
A summary of RSU and PSU activity under the Omnibus Plan as of December 31, 2011 is presented
below.
Weighted- Aggregate Intrinsic
Average Value (In thousands
Shares Fair Value of dollars)
Outstanding at January 1, 2011 .................. 6,044,589 $ 5.08 $87,586
Granted ................................... 549,253 14.78
Vested .................................... (1,992,441) 4.80
Forfeited or Expired ........................... (273,940) 5.47
Outstanding at December 31, 2011 ................ 4,327,461 $ 6.46 $50,718
Additional information pertaining to RSU and PSU activity is as follows:
Years ended December 31,
2011 2010 2009
Total fair value of awards that vested ($ millions) ................ $ 9.6 $ 8.2 $ 6.2
Weighted average grant date fair value of awards ............... $14.78 $10.10 $3.42
Compensation expense for RSUs and PSUs is based on the grant date fair value, and is recognized
ratably over the vesting period. For grants in 2009, 2010 and 2011, the vesting period is three years (25%
in the first year, 25% in the second year and 50% in the third year). In addition to the service vesting
condition, the PSUs granted in March, 2010 had an additional vesting condition which called for the
number of units that will be awarded being based on achievement of a certain level of 2010 Corporate
EBITDA.
123