Hertz 2011 Annual Report Download - page 166
Download and view the complete annual report
Please find page 166 of the 2011 Hertz annual report below. You can navigate through the pages in the report by either clicking on the pages listed below, or by using the keyword search tool below to find specific information within the annual report.-
 1
1 -
2
-
3
-
4
-
5
-
6
-
7
-
8
-
9
-
10
-
11
-
12
-
13
-
14
-
15
-
16
-
17
-
18
-
19
-
20
-
21
-
22
-
23
-
24
-
25
-
26
-
27
-
28
-
29
-
30
-
31
-
32
-
33
-
34
-
35
-
36
-
37
-
38
-
39
-
40
-
41
-
42
-
43
-
44
-
45
-
46
-
47
-
48
-
49
-
50
-
51
-
52
-
53
-
54
-
55
-
56
-
57
-
58
-
59
-
60
-
61
-
62
-
63
-
64
-
65
-
66
-
67
-
68
-
69
-
70
-
71
-
72
-
73
-
74
-
75
-
76
-
77
-
78
-
79
-
80
-
81
-
82
-
83
-
84
-
85
-
86
-
87
-
88
-
89
-
90
-
91
-
92
-
93
-
94
-
95
-
96
-
97
-
98
-
99
-
100
-
101
-
102
-
103
-
104
-
105
-
106
-
107
-
108
-
109
-
110
-
111
-
112
-
113
-
114
-
115
-
116
-
117
-
118
-
119
-
120
-
121
-
122
-
123
-
124
-
125
-
126
-
127
-
128
-
129
-
130
-
131
-
132
-
133
-
134
-
135
-
136
-
137
-
138
-
139
-
140
-
141
-
142
-
143
-
144
-
145
-
146
-
147
-
148
-
149
-
150
-
151
-
152
-
153
-
154
-
155
-
 156
156 -
 157
157 -
 158
158 -
 159
159 -
 160
160 -
 161
161 -
 162
162 -
 163
163 -
 164
164 -
 165
165 -
 166
166 -
 167
167 -
 168
168 -
 169
169 -
 170
170 -
 171
171 -
 172
172 -
 173
173 -
 174
174 -
 175
175 -
 176
176 -
177
-
178
-
179
-
180
-
181
-
182
-
183
-
184
-
185
-
186
-
187
-
188
-
189
-
190
-
191
-
192
-
193
-
194
-
195
-
196
-
197
-
198
-
199
-
200
-
201
-
202
-
203
-
204
-
205
-
206
-
207
-
208
-
209
-
210
-
211
-
212
-
213
-
214
-
215
-
216
 |
 |
HERTZ GLOBAL HOLDINGS, INC. AND SUBSIDIARIES
NOTES TO CONSOLIDATED FINANCIAL STATEMENTS (Continued)
the quoted prices in active markets that are observable either directly or indirectly; and (Level 3)
unobservable inputs in which there is little or no market data, which require the reporting entity to
develop its own assumptions.
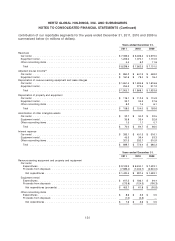
Cash and Cash Equivalents and Restricted Cash and Cash Equivalents
Fair value approximates the amount indicated on the balance sheet at December 31, 2011 and
December 31, 2010 because of the short-term maturity of these instruments. Money market accounts,
whose fair value at December 31, 2011, is measured using Level 1 inputs, totaling $566.0 million and
$142.9 million are included in ‘‘Cash and cash equivalents’’ and ‘‘Restricted cash and cash equivalents,’’
respectively. Money market accounts, whose fair value at December 31, 2010, is measured using Level 1
inputs, totaling $1,747.9 million and $24.1 million are included in ‘‘Cash and cash equivalents’’ and
‘‘Restricted cash and cash equivalents,’’ respectively.
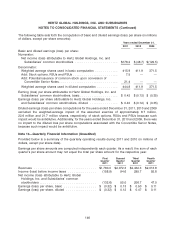
Marketable Securities
Marketable securities held by us consist of equity securities classified as available-for-sale, which are
carried at fair value and are included within ‘‘Prepaid expenses and other assets.’’ Unrealized gains and
losses, net of related income taxes, are included in ‘‘Accumulated other comprehensive income.’’ As of
December 31, 2011 and December 31, 2010, the fair value of marketable securities was $33.2 million
and $0.0 million, respectively. For the year ended December 31, 2011, unrealized gains of $0.3 million
were recorded in ‘‘Accumulated other comprehensive income (loss).’’ Fair values for marketable
securities are based on Level 1 inputs consisting of quoted market prices.
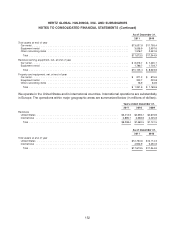
Debt
For borrowings with an initial maturity of 93 days or less, fair value approximates carrying value because
of the short-term nature of these instruments. For all other debt, fair value is estimated based on quoted
market rates as well as borrowing rates currently available to us for loans with similar terms and average
maturities (Level 2 inputs). The aggregate fair value of all debt at December 31, 2011 was
$11,832.5 million, compared to its aggregate unpaid principal balance of $11,400.3 million. The
aggregate fair value of all debt at December 31, 2010 was $12,063.5 million, compared to its aggregate
unpaid principal balance of $11,429.6 million.
140