Hertz 2011 Annual Report Download - page 152
Download and view the complete annual report
Please find page 152 of the 2011 Hertz annual report below. You can navigate through the pages in the report by either clicking on the pages listed below, or by using the keyword search tool below to find specific information within the annual report.-
 1
1 -
2
-
3
-
4
-
5
-
6
-
7
-
8
-
9
-
10
-
11
-
12
-
13
-
14
-
15
-
16
-
17
-
18
-
19
-
20
-
21
-
22
-
23
-
24
-
25
-
26
-
27
-
28
-
29
-
30
-
31
-
32
-
33
-
34
-
35
-
36
-
37
-
38
-
39
-
40
-
41
-
42
-
43
-
44
-
45
-
46
-
47
-
48
-
49
-
50
-
51
-
52
-
53
-
54
-
55
-
56
-
57
-
58
-
59
-
60
-
61
-
62
-
63
-
64
-
65
-
66
-
67
-
68
-
69
-
70
-
71
-
72
-
73
-
74
-
75
-
76
-
77
-
78
-
79
-
80
-
81
-
82
-
83
-
84
-
85
-
86
-
87
-
88
-
89
-
90
-
91
-
92
-
93
-
94
-
95
-
96
-
97
-
98
-
99
-
100
-
101
-
102
-
103
-
104
-
105
-
106
-
107
-
108
-
109
-
110
-
111
-
112
-
113
-
114
-
115
-
116
-
117
-
118
-
119
-
120
-
121
-
122
-
123
-
124
-
125
-
126
-
127
-
128
-
129
-
130
-
131
-
132
-
133
-
134
-
135
-
136
-
137
-
138
-
139
-
140
-
141
-
 142
142 -
 143
143 -
 144
144 -
 145
145 -
 146
146 -
 147
147 -
 148
148 -
 149
149 -
 150
150 -
 151
151 -
 152
152 -
 153
153 -
 154
154 -
 155
155 -
 156
156 -
 157
157 -
 158
158 -
 159
159 -
 160
160 -
 161
161 -
 162
162 -
163
-
164
-
165
-
166
-
167
-
168
-
169
-
170
-
171
-
172
-
173
-
174
-
175
-
176
-
177
-
178
-
179
-
180
-
181
-
182
-
183
-
184
-
185
-
186
-
187
-
188
-
189
-
190
-
191
-
192
-
193
-
194
-
195
-
196
-
197
-
198
-
199
-
200
-
201
-
202
-
203
-
204
-
205
-
206
-
207
-
208
-
209
-
210
-
211
-
212
-
213
-
214
-
215
-
216
 |
 |

HERTZ GLOBAL HOLDINGS, INC. AND SUBSIDIARIES
NOTES TO CONSOLIDATED FINANCIAL STATEMENTS (Continued)
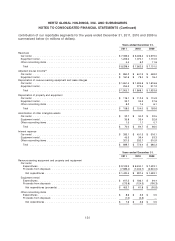
The total provision (benefit) for taxes on income consists of the following (in millions of dollars):
Years ended December 31,
2011 2010 2009
Current:
Federal ................................. $ 0.6 $ 0.1 $ 1.0
Foreign ................................. 30.6 41.5 16.1
State and local ............................ 28.5 1.5 (1.2)
Total current ............................ 59.7 43.1 15.9
Deferred:
Federal ................................. 76.2 (25.0) (36.3)
Foreign ................................. (3.2) 1.3 (23.8)
State and local ............................ (4.2) (2.7) (17.9)
Total deferred ........................... 68.8 (26.4) (78.0)
Total provision (benefit) ................... $128.5 $ 16.7 $(62.1)
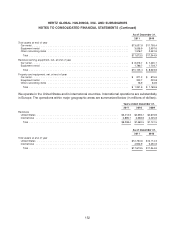
The principal items of the U.S. and foreign net deferred tax assets and liabilities at December 31, 2011
and 2010 are as follows (in millions of dollars):
2011 2010
Deferred Tax Assets:
Employee benefit plans ..................................... $ 102.8 $ 83.3
Net operating loss carryforwards .............................. 1,743.5 1,407.4
Foreign tax credit carryforwards ............................... 20.8 20.8
Federal, state and foreign local tax credit carryforwards .............. 15.0 4.8
Accrued and prepaid expenses ............................... 300.8 191.9
Total Deferred Tax Assets .................................... 2,182.9 1,708.2
Less: Valuation Allowance ................................... (186.7) (185.8)
Total Net Deferred Tax Assets ................................. 1,996.2 1,522.4
Deferred Tax Liabilities:
Depreciation on tangible assets ............................... (2,742.3) (2,003.5)
Intangible assets .......................................... (942.4) (1,027.0)
Total Deferred Tax Liabilities .................................. (3,684.7) (3,030.5)
Net Deferred Tax Liability .................................. $(1,688.5) $(1,508.1)
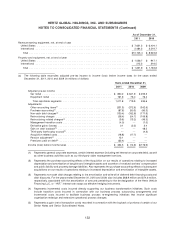
As of December 31, 2011, deferred tax assets of $1,481.7 million were recorded for unutilized U.S.
Federal Net Operating Losses, or ‘‘NOL,’’ carry forwards of $4,233.3 million. The total Federal NOL carry
forwards are $4,278.1 million of which $44.8 million relate to excess tax deductions associated with
stock option plans which have yet to reduce taxes payable. Upon the utilization of these carry forwards,
the associated tax benefits of approximately $15.7 million will be recorded to Additional Paid-in Capital.
The Federal NOLs begin to expire in 2025. State NOLs exclusive of the effects of the excess tax
deductions, have generated a deferred tax asset of $77.4 million. The state NOLs expire over various
years beginning in 2012 depending upon particular jurisdiction.
126