Hertz 2011 Annual Report Download - page 145
Download and view the complete annual report
Please find page 145 of the 2011 Hertz annual report below. You can navigate through the pages in the report by either clicking on the pages listed below, or by using the keyword search tool below to find specific information within the annual report.-
 1
1 -
2
-
3
-
4
-
5
-
6
-
7
-
8
-
9
-
10
-
11
-
12
-
13
-
14
-
15
-
16
-
17
-
18
-
19
-
20
-
21
-
22
-
23
-
24
-
25
-
26
-
27
-
28
-
29
-
30
-
31
-
32
-
33
-
34
-
35
-
36
-
37
-
38
-
39
-
40
-
41
-
42
-
43
-
44
-
45
-
46
-
47
-
48
-
49
-
50
-
51
-
52
-
53
-
54
-
55
-
56
-
57
-
58
-
59
-
60
-
61
-
62
-
63
-
64
-
65
-
66
-
67
-
68
-
69
-
70
-
71
-
72
-
73
-
74
-
75
-
76
-
77
-
78
-
79
-
80
-
81
-
82
-
83
-
84
-
85
-
86
-
87
-
88
-
89
-
90
-
91
-
92
-
93
-
94
-
95
-
96
-
97
-
98
-
99
-
100
-
101
-
102
-
103
-
104
-
105
-
106
-
107
-
108
-
109
-
110
-
111
-
112
-
113
-
114
-
115
-
116
-
117
-
118
-
119
-
120
-
121
-
122
-
123
-
124
-
125
-
126
-
127
-
128
-
129
-
130
-
131
-
132
-
133
-
134
-
 135
135 -
 136
136 -
 137
137 -
 138
138 -
 139
139 -
 140
140 -
 141
141 -
 142
142 -
 143
143 -
 144
144 -
 145
145 -
 146
146 -
 147
147 -
 148
148 -
 149
149 -
 150
150 -
 151
151 -
 152
152 -
 153
153 -
 154
154 -
 155
155 -
156
-
157
-
158
-
159
-
160
-
161
-
162
-
163
-
164
-
165
-
166
-
167
-
168
-
169
-
170
-
171
-
172
-
173
-
174
-
175
-
176
-
177
-
178
-
179
-
180
-
181
-
182
-
183
-
184
-
185
-
186
-
187
-
188
-
189
-
190
-
191
-
192
-
193
-
194
-
195
-
196
-
197
-
198
-
199
-
200
-
201
-
202
-
203
-
204
-
205
-
206
-
207
-
208
-
209
-
210
-
211
-
212
-
213
-
214
-
215
-
216
 |
 |

HERTZ GLOBAL HOLDINGS, INC. AND SUBSIDIARIES
NOTES TO CONSOLIDATED FINANCIAL STATEMENTS (Continued)
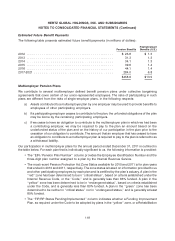
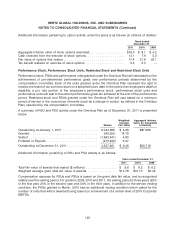
Estimated Future Benefit Payments
The following table presents estimated future benefit payments (in millions of dollars):
Postretirement
Pension Benefits Benefits (U.S.)
2012 .............................................. $ 25.8 $ 1.3
2013 .............................................. 31.3 1.3
2014 .............................................. 34.1 1.3
2015 .............................................. 39.6 1.4
2016 .............................................. 44.1 1.4
2017-2021 .......................................... 284.0 6.8
$458.9 $13.5
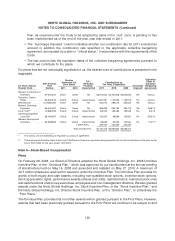
Multiemployer Pension Plans
We contribute to several multiemployer defined benefit pension plans under collective bargaining
agreements that cover certain of our union-represented employees. The risks of participating in such
plans are different from the risks of single-employer plans, in the following respects:
a) Assets contributed to a multiemployer plan by one employer may be used to provide benefits to
employees of other participating employers.
b) If a participating employer ceases to contribute to the plan, the unfunded obligations of the plan
may be borne by the remaining participating employers.
c) If we cease to have an obligation to contribute to the multiemployer plan in which we had been
a contributing employer, we may be required to pay to the plan an amount based on the
underfunded status of the plan and on the history of our participation in the plan prior to the
cessation of our obligation to contribute. The amount that an employer that has ceased to have
an obligation to contribute to a multiemployer plan is required to pay to the plan is referred to as
a withdrawal liability.
Our participation in multiemployer plans for the annual period ended December 31, 2011 is outlined in
the table below. For each plan that is individually significant to us, the following information is provided:
• The ‘‘EIN / Pension Plan Number’’ column provides the Employee Identification Number and the
three-digit plan number assigned to a plan by the Internal Revenue Service.
• The most recent Pension Protection Act Zone Status available for 2010 and 2011 is for plan years
that ended in 2010 and 2011, respectively. The zone status is based on information provided to us
and other participating employers by each plan and is certified by the plan’s actuary. A plan in the
‘‘red’’ zone has been determined to be in ‘‘critical status’’, based on criteria established under the
Internal Revenue Code, or the ‘‘Code,’’ and is generally less than 65% funded. A plan in the
‘‘yellow’’ zone has been determined to be in ‘‘endangered status’’, based on criteria established
under the Code, and is generally less than 80% funded. A plan in the ‘‘green’’ zone has been
determined to be neither in ‘‘critical status’’ nor in ‘‘endangered status,’’ and is generally at least
80% funded.
• The ‘‘FIP/RP Status Pending/Implemented’’ column indicates whether a Funding Improvement
Plan, as required under the Code to be adopted by plans in the ‘‘yellow’’ zone, or a Rehabilitation
119