Hertz 2011 Annual Report Download - page 116
Download and view the complete annual report
Please find page 116 of the 2011 Hertz annual report below. You can navigate through the pages in the report by either clicking on the pages listed below, or by using the keyword search tool below to find specific information within the annual report.-
 1
1 -
2
-
3
-
4
-
5
-
6
-
7
-
8
-
9
-
10
-
11
-
12
-
13
-
14
-
15
-
16
-
17
-
18
-
19
-
20
-
21
-
22
-
23
-
24
-
25
-
26
-
27
-
28
-
29
-
30
-
31
-
32
-
33
-
34
-
35
-
36
-
37
-
38
-
39
-
40
-
41
-
42
-
43
-
44
-
45
-
46
-
47
-
48
-
49
-
50
-
51
-
52
-
53
-
54
-
55
-
56
-
57
-
58
-
59
-
60
-
61
-
62
-
63
-
64
-
65
-
66
-
67
-
68
-
69
-
70
-
71
-
72
-
73
-
74
-
75
-
76
-
77
-
78
-
79
-
80
-
81
-
82
-
83
-
84
-
85
-
86
-
87
-
88
-
89
-
90
-
91
-
92
-
93
-
94
-
95
-
96
-
97
-
98
-
99
-
100
-
101
-
102
-
103
-
104
-
105
-
 106
106 -
 107
107 -
 108
108 -
 109
109 -
 110
110 -
 111
111 -
 112
112 -
 113
113 -
 114
114 -
 115
115 -
 116
116 -
 117
117 -
 118
118 -
 119
119 -
 120
120 -
 121
121 -
 122
122 -
 123
123 -
 124
124 -
 125
125 -
 126
126 -
127
-
128
-
129
-
130
-
131
-
132
-
133
-
134
-
135
-
136
-
137
-
138
-
139
-
140
-
141
-
142
-
143
-
144
-
145
-
146
-
147
-
148
-
149
-
150
-
151
-
152
-
153
-
154
-
155
-
156
-
157
-
158
-
159
-
160
-
161
-
162
-
163
-
164
-
165
-
166
-
167
-
168
-
169
-
170
-
171
-
172
-
173
-
174
-
175
-
176
-
177
-
178
-
179
-
180
-
181
-
182
-
183
-
184
-
185
-
186
-
187
-
188
-
189
-
190
-
191
-
192
-
193
-
194
-
195
-
196
-
197
-
198
-
199
-
200
-
201
-
202
-
203
-
204
-
205
-
206
-
207
-
208
-
209
-
210
-
211
-
212
-
213
-
214
-
215
-
216
 |
 |

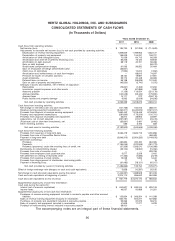
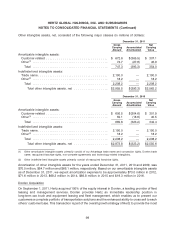
HERTZ GLOBAL HOLDINGS, INC. AND SUBSIDIARIES
CONSOLIDATED STATEMENTS OF CASH FLOWS
(In Thousands of Dollars)
Years ended December 31,
2011 2010 2009
Cash flows from operating activities:
Net income (loss) ............................................. $ 195,730 $ (31,298) $ (114,849)
Adjustments to reconcile net income (loss) to net cash provided by operating activities:
Depreciation of revenue earning equipment ............................. 1,809,609 1,789,903 1,852,127
Depreciation of property and equipment ............................... 158,009 154,031 158,727
Amortization of other intangible assets ................................ 70,039 64,713 66,059
Amortization and write-off of deferred financing costs ....................... 92,206 73,120 58,849
Amortization of debt discount ..................................... 38,119 40,701 38,458
Gain on debt buyback ......................................... — — (48,472)
Stock-based compensation charges ................................. 31,093 36,560 35,464
Gain on revaluation of foreign denominated debt .......................... (26,641) — —
(Gain) loss on derivatives ....................................... (7,990) 10,810 (1,552)
Amortization and ineffectiveness of cash flow hedges ....................... — 68,815 74,597
Provision for losses on doubtful accounts .............................. 28,164 19,667 27,951
Asset writedowns ............................................ 23,174 20,448 36,063
Deferred taxes on income ....................................... 68,138 (26,529) 107,942
Gain on sale of property and equipment ............................... (43,520) (5,740) (1,072)
Changes in assets and liabilities, net of effects of acquisition:
Receivables ............................................... (79,851) (7,459) 37,234
Inventories, prepaid expenses and other assets ........................... 478 (61,886) 7,538
Accounts payable ............................................ (1,139) 119,054 (221,179)
Accrued liabilities ............................................ (144,048) (53,445) (179,920)
Accrued taxes .............................................. 15,177 272 (206,115)
Public liability and property damage ................................. 6,592 (3,058) (34,536)
Net cash provided by operating activities ............................. 2,233,339 2,208,679 1,693,314
Cash flows from investing activities:
Net change in restricted cash and cash equivalents ......................... (101,766) 160,516 368,721
Revenue earning equipment expenditures ............................... (9,454,311) (8,440,872) (7,527,317)
Proceeds from disposal of revenue earning equipment ........................ 7,850,442 7,518,446 6,106,624
Property and equipment expenditures ................................. (281,695) (179,209) (100,701)
Proceeds from disposal of property and equipment .......................... 53,814 38,905 23,697
Acquisitions, net of cash acquired .................................... (227,081) (47,571) (76,419)
(Purchase) sale of short-term investments, net ............................. (32,891) 3,491 (3,492)
Other investing activities ......................................... 586 2,726 828
Net cash used in investing activities ................................ (2,192,902) (943,568) (1,208,059)
Cash flows from financing activities:
Proceeds from issuance of long-term debt ............................... 3,062,479 2,635,713 1,200,896
Proceeds from sale of Convertible Senior Notes ............................ — — 459,483
Payment of long-term debt ........................................ (3,649,315) (2,954,233) (1,149,876)
Short-term borrowings:
Proceeds ................................................. 460,890 490,490 364,065
Payments ................................................. (1,194,056) (970,949) (351,773)
Proceeds (payments) under the revolving lines of credit, net ................... (57,329) 1,026,070 (1,126,099)
Distributions to noncontrolling interest ................................. (23,100) (18,200) (15,050)
Proceeds from sale of common stock .................................. — — 528,758
Proceeds from employee stock purchase plan ............................. 3,577 3,208 2,400
Net settlement on vesting of restricted stock .............................. (11,465) (7,836) (2,219)
Proceeds from exercise of stock options ................................ 13,058 7,635 5,342
Proceeds from disgorgement of stockholder short-swing profits ................... 77 7 19
Payment of financing costs ........................................ (91,482) (78,151) (45,017)
Net cash provided by (used in) financing activities ........................ (1,486,666) 133,754 (129,071)
Effect of foreign exchange rate changes on cash and cash equivalents ............... 3,838 (10,337) 35,192
Net change in cash and cash equivalents during the period ...................... (1,442,391) 1,388,528 391,376
Cash and cash equivalents at beginning of period ............................ 2,374,170 985,642 594,266
Cash and cash equivalents at end of period ............................... $ 931,779 $ 2,374,170 $ 985,642
Supplemental disclosures of cash flow information:
Cash paid during the period for:
Interest (net of amounts capitalized) ................................... $ 640,627 $ 533,044 $ 635,153
Income taxes ................................................ 49,557 50,688 31,321
Supplemental disclosures of non-cash flow information:
Purchases of revenue earning equipment included in accounts payable and other accrued
liabilities ................................................. $ 153,634 $ 266,354 $ 141,039
Sales of revenue earning equipment included in receivables .................... 620,724 504,217 537,862
Purchases of property and equipment included in accounts payable ................ 53,263 37,379 38,210
Sales of property and equipment included in receivables ...................... 41,809 11,071 5,229
Purchase of noncontrolling interest included in accounts payable ................. 38,000 — —
The accompanying notes are an integral part of these financial statements.
90