Hertz 2011 Annual Report Download - page 155
Download and view the complete annual report
Please find page 155 of the 2011 Hertz annual report below. You can navigate through the pages in the report by either clicking on the pages listed below, or by using the keyword search tool below to find specific information within the annual report.-
 1
1 -
2
-
3
-
4
-
5
-
6
-
7
-
8
-
9
-
10
-
11
-
12
-
13
-
14
-
15
-
16
-
17
-
18
-
19
-
20
-
21
-
22
-
23
-
24
-
25
-
26
-
27
-
28
-
29
-
30
-
31
-
32
-
33
-
34
-
35
-
36
-
37
-
38
-
39
-
40
-
41
-
42
-
43
-
44
-
45
-
46
-
47
-
48
-
49
-
50
-
51
-
52
-
53
-
54
-
55
-
56
-
57
-
58
-
59
-
60
-
61
-
62
-
63
-
64
-
65
-
66
-
67
-
68
-
69
-
70
-
71
-
72
-
73
-
74
-
75
-
76
-
77
-
78
-
79
-
80
-
81
-
82
-
83
-
84
-
85
-
86
-
87
-
88
-
89
-
90
-
91
-
92
-
93
-
94
-
95
-
96
-
97
-
98
-
99
-
100
-
101
-
102
-
103
-
104
-
105
-
106
-
107
-
108
-
109
-
110
-
111
-
112
-
113
-
114
-
115
-
116
-
117
-
118
-
119
-
120
-
121
-
122
-
123
-
124
-
125
-
126
-
127
-
128
-
129
-
130
-
131
-
132
-
133
-
134
-
135
-
136
-
137
-
138
-
139
-
140
-
141
-
142
-
143
-
144
-
 145
145 -
 146
146 -
 147
147 -
 148
148 -
 149
149 -
 150
150 -
 151
151 -
 152
152 -
 153
153 -
 154
154 -
 155
155 -
 156
156 -
 157
157 -
 158
158 -
 159
159 -
 160
160 -
 161
161 -
 162
162 -
 163
163 -
 164
164 -
 165
165 -
166
-
167
-
168
-
169
-
170
-
171
-
172
-
173
-
174
-
175
-
176
-
177
-
178
-
179
-
180
-
181
-
182
-
183
-
184
-
185
-
186
-
187
-
188
-
189
-
190
-
191
-
192
-
193
-
194
-
195
-
196
-
197
-
198
-
199
-
200
-
201
-
202
-
203
-
204
-
205
-
206
-
207
-
208
-
209
-
210
-
211
-
212
-
213
-
214
-
215
-
216
 |
 |

HERTZ GLOBAL HOLDINGS, INC. AND SUBSIDIARIES
NOTES TO CONSOLIDATED FINANCIAL STATEMENTS (Continued)
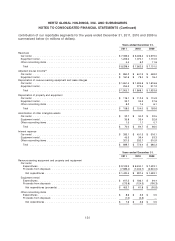
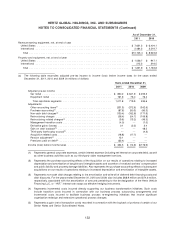
Note 9—Lease and Concession Agreements
We have various concession agreements, which provide for payment of rents and a percentage of
revenue with a guaranteed minimum, and real estate leases under which the following amounts were
expensed (in millions of dollars):
Years ended December 31,
2011 2010 2009
Rents ................................................ $130.6 $133.9 $133.2
Concession fees:
Minimum fixed obligations ................................ 248.7 252.0 260.1
Additional amounts, based on revenues ...................... 311.8 278.7 231.5
Total .............................................. $691.1 $664.6 $624.8
For the years ended December 31, 2011, 2010 and 2009, sublease income reduced rent expense
included in the above table by $5.0 million, $4.5 million and $5.0 million, respectively.
As of December 31, 2011, minimum obligations under existing agreements referred to above are
approximately as follows (in millions of dollars):
Rents Concessions
2012 ..................................................... $119.4 $315.6
2013 ..................................................... 96.6 263.4
2014 ..................................................... 74.5 182.2
2015 ..................................................... 55.6 120.1
2016 ..................................................... 37.4 73.6
Years after 2016 ............................................. 151.2 387.6
The future minimum rent payments in the above table have been reduced by minimum future sublease
rental inflows in aggregate of $16.4 million.
Many of our concession agreements and real estate leases require us to pay or reimburse operating
expenses, such as common area charges and real estate taxes, to pay concession fees above
guaranteed minimums or additional rent based on a percentage of revenues or sales (as defined in
those agreements) arising at the relevant premises, or both. Such obligations are not reflected in the
table of minimum future obligations appearing immediately above. We operate from various leased
premises under operating leases with terms up to 25 years. A number of our operating leases contain
renewal options. These renewal options vary, but the majority include clauses for renewal for various
term lengths at various rates, both fixed and market.
In addition to the above, we have various leases on revenue earning equipment and office and computer
equipment under which the following amounts were expensed (in millions of dollars):
Years ended December 31,
2011 2010 2009
Revenue earning equipment .................................. $ 96.1 $78.2 $81.7
Office and computer equipment ............................... 10.1 10.4 8.9
Total ................................................. $106.2 $88.6 $90.6
129