Hertz 2011 Annual Report Download - page 90
Download and view the complete annual report
Please find page 90 of the 2011 Hertz annual report below. You can navigate through the pages in the report by either clicking on the pages listed below, or by using the keyword search tool below to find specific information within the annual report.-
 1
1 -
2
-
3
-
4
-
5
-
6
-
7
-
8
-
9
-
10
-
11
-
12
-
13
-
14
-
15
-
16
-
17
-
18
-
19
-
20
-
21
-
22
-
23
-
24
-
25
-
26
-
27
-
28
-
29
-
30
-
31
-
32
-
33
-
34
-
35
-
36
-
37
-
38
-
39
-
40
-
41
-
42
-
43
-
44
-
45
-
46
-
47
-
48
-
49
-
50
-
51
-
52
-
53
-
54
-
55
-
56
-
57
-
58
-
59
-
60
-
61
-
62
-
63
-
64
-
65
-
66
-
67
-
68
-
69
-
70
-
71
-
72
-
73
-
74
-
75
-
76
-
77
-
78
-
79
-
 80
80 -
 81
81 -
 82
82 -
 83
83 -
 84
84 -
 85
85 -
 86
86 -
 87
87 -
 88
88 -
 89
89 -
 90
90 -
 91
91 -
 92
92 -
 93
93 -
 94
94 -
 95
95 -
 96
96 -
 97
97 -
 98
98 -
 99
99 -
 100
100 -
101
-
102
-
103
-
104
-
105
-
106
-
107
-
108
-
109
-
110
-
111
-
112
-
113
-
114
-
115
-
116
-
117
-
118
-
119
-
120
-
121
-
122
-
123
-
124
-
125
-
126
-
127
-
128
-
129
-
130
-
131
-
132
-
133
-
134
-
135
-
136
-
137
-
138
-
139
-
140
-
141
-
142
-
143
-
144
-
145
-
146
-
147
-
148
-
149
-
150
-
151
-
152
-
153
-
154
-
155
-
156
-
157
-
158
-
159
-
160
-
161
-
162
-
163
-
164
-
165
-
166
-
167
-
168
-
169
-
170
-
171
-
172
-
173
-
174
-
175
-
176
-
177
-
178
-
179
-
180
-
181
-
182
-
183
-
184
-
185
-
186
-
187
-
188
-
189
-
190
-
191
-
192
-
193
-
194
-
195
-
196
-
197
-
198
-
199
-
200
-
201
-
202
-
203
-
204
-
205
-
206
-
207
-
208
-
209
-
210
-
211
-
212
-
213
-
214
-
215
-
216
 |
 |
ITEM 7. MANAGEMENT’S DISCUSSION AND ANALYSIS OF FINANCIAL CONDITION AND
RESULTS OF OPERATIONS (Continued)
Interest Expense
Car Rental Segment
Interest expense for our car rental segment of $333.1 million for 2011 decreased 17.0% from
$401.3 million for 2010. The decrease was primarily due to lower interest rates in 2011, partly offset by an
increase in the weighted average debt outstanding as a result of an increased fleet size.
Equipment Rental Segment
Interest expense for our equipment rental segment of $45.3 million for 2011 increased 15.0% from
$39.4 million for 2010. The increase was primarily due to a portion of the write-off of the unamortized debt
costs in connection with the refinancing of our Senior ABL Facility which was allocated to our equipment
rental segment in 2011.
Other
Other interest expense relating to interest on corporate debt of $321.3 million for 2011 decreased 3.5%
from $332.7 million for 2010. The decrease was primarily due to lower rates in 2011, partly offset by
increases due to the write-off of unamortized debt costs in connection with the refinancing of our Senior
Term Facility and Senior ABL Facility, financing costs incurred in connection with the new Senior Term
Facility and the write-off of unamortized debt costs in connection with the redemption of our 10.5%
Senior Subordinated Notes and a portion of our 8.875% Senior Notes in 2011.
Interest Income
Interest income decreased $6.8 million primarily due to interest on a value added tax reclaim received in
2010.
Other (Income) Expense, Net
Other (income) expense, net increased $62.5 million primarily due to premiums paid in connection with
the redemption of our 10.5% Senior Subordinated Notes and a portion of our 8.875% Senior Notes
during 2011.
ADJUSTED PRE-TAX INCOME (LOSS)
Car Rental Segment
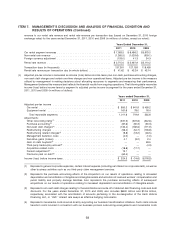
Adjusted pre-tax income for our car rental segment of $850.2 million increased 32.5% from
$641.9 million for 2010. The increase was primarily due to stronger volumes, improved residual values
and disciplined cost management, partly offset by decreased pricing. Adjustments to our car rental
segment income before income taxes for 2011 totaled $94.5 million (which consists of non-cash debt
charges of $43.9 million, purchase accounting of $39.5 million, restructuring and restructuring related
charges of $23.6 million, pension adjustment of $(13.1) million and loss on derivatives of $0.6 million).
Adjustments to our car rental segment income before income taxes for 2010 totaled $200.1 million
(which consists of non-cash debt charges of $133.3 million, purchase accounting of $37.0 million,
restructuring and restructuring related charges of $30.0 million and gain on derivatives of $(0.2) million).
See footnote (c) to the table under ‘‘Results of Operations’’ for a summary and description of these
adjustments.
64