Hertz 2011 Annual Report Download - page 32
Download and view the complete annual report
Please find page 32 of the 2011 Hertz annual report below. You can navigate through the pages in the report by either clicking on the pages listed below, or by using the keyword search tool below to find specific information within the annual report.-
 1
1 -
2
-
3
-
4
-
5
-
6
-
7
-
8
-
9
-
10
-
11
-
12
-
13
-
14
-
15
-
16
-
17
-
18
-
19
-
20
-
21
-
 22
22 -
 23
23 -
 24
24 -
 25
25 -
 26
26 -
 27
27 -
 28
28 -
 29
29 -
 30
30 -
 31
31 -
 32
32 -
 33
33 -
 34
34 -
 35
35 -
 36
36 -
 37
37 -
 38
38 -
 39
39 -
 40
40 -
 41
41 -
 42
42 -
43
-
44
-
45
-
46
-
47
-
48
-
49
-
50
-
51
-
52
-
53
-
54
-
55
-
56
-
57
-
58
-
59
-
60
-
61
-
62
-
63
-
64
-
65
-
66
-
67
-
68
-
69
-
70
-
71
-
72
-
73
-
74
-
75
-
76
-
77
-
78
-
79
-
80
-
81
-
82
-
83
-
84
-
85
-
86
-
87
-
88
-
89
-
90
-
91
-
92
-
93
-
94
-
95
-
96
-
97
-
98
-
99
-
100
-
101
-
102
-
103
-
104
-
105
-
106
-
107
-
108
-
109
-
110
-
111
-
112
-
113
-
114
-
115
-
116
-
117
-
118
-
119
-
120
-
121
-
122
-
123
-
124
-
125
-
126
-
127
-
128
-
129
-
130
-
131
-
132
-
133
-
134
-
135
-
136
-
137
-
138
-
139
-
140
-
141
-
142
-
143
-
144
-
145
-
146
-
147
-
148
-
149
-
150
-
151
-
152
-
153
-
154
-
155
-
156
-
157
-
158
-
159
-
160
-
161
-
162
-
163
-
164
-
165
-
166
-
167
-
168
-
169
-
170
-
171
-
172
-
173
-
174
-
175
-
176
-
177
-
178
-
179
-
180
-
181
-
182
-
183
-
184
-
185
-
186
-
187
-
188
-
189
-
190
-
191
-
192
-
193
-
194
-
195
-
196
-
197
-
198
-
199
-
200
-
201
-
202
-
203
-
204
-
205
-
206
-
207
-
208
-
209
-
210
-
211
-
212
-
213
-
214
-
215
-
216
 |
 |

18FEB201219451075
18FEB201219450949 18FEB201219451199
ITEM 1. BUSINESS (Continued)
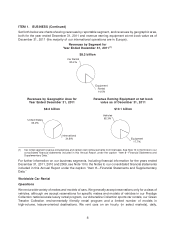
Set forth below are charts showing revenues by reportable segment, and revenues by geographic area,
both for the year ended December 31, 2011 and revenue earning equipment at net book value as of
December 31, 2011 (the majority of our international operations are in Europe).
Revenues by Segment for
Year Ended December 31, 2011(1)
$8.3 billion
Equipment
Rental
14.6%
Car Rental
85.4%
Revenues by Geographic Area for Revenue Earning Equipment at net book
Year Ended December 31, 2011 value as of December 31, 2011
$8.3 billion $10.1 billion
United States
65.2%
International
34.8% Equipment
17.7%
Vehicles
82.3%
(1) Car rental segment revenue includes fees and certain cost reimbursements from licensees. See Note 10 to the Notes to our
consolidated financial statements included in this Annual Report under the caption ‘‘Item 8—Financial Statements and
Supplementary Data.’’
For further information on our business segments, including financial information for the years ended
December 31, 2011, 2010 and 2009, see Note 10 to the Notes to our consolidated financial statements
included in this Annual Report under the caption ‘‘Item 8—Financial Statements and Supplementary
Data.’’
Worldwide Car Rental
Operations
We rent a wide variety of makes and models of cars. We generally accept reservations only for a class of
vehicles, although we accept reservations for specific makes and models of vehicles in our Prestige
Collection national-scale luxury rental program, our Adrenaline Collection sports car rentals, our Green
Traveler Collection environmentally friendly rental program and a limited number of models in
high-volume, leisure-oriented destinations. We rent cars on an hourly (in select markets), daily,
6