Hertz 2011 Annual Report Download - page 89
Download and view the complete annual report
Please find page 89 of the 2011 Hertz annual report below. You can navigate through the pages in the report by either clicking on the pages listed below, or by using the keyword search tool below to find specific information within the annual report.-
 1
1 -
2
-
3
-
4
-
5
-
6
-
7
-
8
-
9
-
10
-
11
-
12
-
13
-
14
-
15
-
16
-
17
-
18
-
19
-
20
-
21
-
22
-
23
-
24
-
25
-
26
-
27
-
28
-
29
-
30
-
31
-
32
-
33
-
34
-
35
-
36
-
37
-
38
-
39
-
40
-
41
-
42
-
43
-
44
-
45
-
46
-
47
-
48
-
49
-
50
-
51
-
52
-
53
-
54
-
55
-
56
-
57
-
58
-
59
-
60
-
61
-
62
-
63
-
64
-
65
-
66
-
67
-
68
-
69
-
70
-
71
-
72
-
73
-
74
-
75
-
76
-
77
-
78
-
 79
79 -
 80
80 -
 81
81 -
 82
82 -
 83
83 -
 84
84 -
 85
85 -
 86
86 -
 87
87 -
 88
88 -
 89
89 -
 90
90 -
 91
91 -
 92
92 -
 93
93 -
 94
94 -
 95
95 -
 96
96 -
 97
97 -
 98
98 -
 99
99 -
100
-
101
-
102
-
103
-
104
-
105
-
106
-
107
-
108
-
109
-
110
-
111
-
112
-
113
-
114
-
115
-
116
-
117
-
118
-
119
-
120
-
121
-
122
-
123
-
124
-
125
-
126
-
127
-
128
-
129
-
130
-
131
-
132
-
133
-
134
-
135
-
136
-
137
-
138
-
139
-
140
-
141
-
142
-
143
-
144
-
145
-
146
-
147
-
148
-
149
-
150
-
151
-
152
-
153
-
154
-
155
-
156
-
157
-
158
-
159
-
160
-
161
-
162
-
163
-
164
-
165
-
166
-
167
-
168
-
169
-
170
-
171
-
172
-
173
-
174
-
175
-
176
-
177
-
178
-
179
-
180
-
181
-
182
-
183
-
184
-
185
-
186
-
187
-
188
-
189
-
190
-
191
-
192
-
193
-
194
-
195
-
196
-
197
-
198
-
199
-
200
-
201
-
202
-
203
-
204
-
205
-
206
-
207
-
208
-
209
-
210
-
211
-
212
-
213
-
214
-
215
-
216
 |
 |
ITEM 7. MANAGEMENT’S DISCUSSION AND ANALYSIS OF FINANCIAL CONDITION AND
RESULTS OF OPERATIONS (Continued)
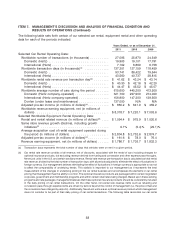
Fleet related expenses for our equipment rental segment of $193.8 million for 2011 increased
$13.1 million, or 7.2% from 2010. The increase was primarily related to continued aging of the fleet
which resulted in an increase in maintenance costs of $11.2 million and increased worldwide rental
volume resulting in increased freight and delivery costs of $6.5 million, as well as the effects of
foreign currency translation of approximately $2.6 million. These increases were partly offset by
decreases in insurance and licenses of $3.8 million and personal property taxes of $2.6 million.
Personnel related expenses for our equipment rental segment of $222.2 million for 2011 increased
$12.4 million, or 5.9% from 2010. The increase was related to increases in salaries and related
expenses of $9.0 million primarily related to improved results, as well as the effects of foreign
currency translation of approximately $3.3 million.
Depreciation of Revenue Earning Equipment and Lease Charges
Car Rental Segment
Depreciation of revenue earning equipment and lease charges for our car rental segment of
$1,651.4 million for 2011 increased 3.6% from $1,594.6 million for 2010. The increase was primarily due
the effects of foreign currency translation of approximately $34.8 million, a 7.5% increase in average fleet
and an increase due to the acquisition of Donlen and its related depreciation expense of $117.0 million.
The increase was partly offset by an improvement in certain vehicle residual values and a change in mix
of vehicles.
Equipment Rental Segment
Depreciation of revenue earning equipment and lease charges in our equipment rental segment of
$254.3 million for 2011 decreased 7.0% from $273.5 million for 2010. The decrease was primarily due to
higher residual values on the disposal of used equipment, partly offset by a 2.6% increase in the average
acquisition cost of rental equipment operated during the period and the effects of foreign currency
translation of approximately $3.1 million.
Selling, General and Administrative Expenses
Selling, general and administrative expenses increased 12.2%, due to increases in administrative, sales
promotion and advertising expenses.
Administrative expenses increased $54.5 million, or 13.6%, primarily due to increases in salaries
and related expenses of $34.0 million, consulting expenses of $8.8 million, travel and entertainment
expenses of $3.5 million and legal expense of $2.5 million, as well as the effects of foreign currency
translation of approximately $8.4 million, partly offset by a decrease in unrealized loss on derivatives
of $3.4 million.
Sales promotion expenses increased $14.3 million, or 11.1%, primarily related to increases in sales
salaries and commissions due to improved results, as well as the effects of foreign currency
translation of approximately $2.7 million.
Advertising expenses increased $12.0 million, or 9.0%, primarily due to increased media and
production related to the new campaign (‘‘Gas and Brake’’), as well as the effects of foreign
currency translation of approximately $4.3 million.
63