Hertz 2011 Annual Report Download - page 4
Download and view the complete annual report
Please find page 4 of the 2011 Hertz annual report below. You can navigate through the pages in the report by either clicking on the pages listed below, or by using the keyword search tool below to find specific information within the annual report.-
 1
1 -
 2
2 -
 3
3 -
 4
4 -
 5
5 -
 6
6 -
 7
7 -
 8
8 -
 9
9 -
 10
10 -
 11
11 -
 12
12 -
 13
13 -
 14
14 -
 15
15 -
16
-
17
-
18
-
19
-
20
-
21
-
22
-
23
-
24
-
25
-
26
-
27
-
28
-
29
-
30
-
31
-
32
-
33
-
34
-
35
-
36
-
37
-
38
-
39
-
40
-
41
-
42
-
43
-
44
-
45
-
46
-
47
-
48
-
49
-
50
-
51
-
52
-
53
-
54
-
55
-
56
-
57
-
58
-
59
-
60
-
61
-
62
-
63
-
64
-
65
-
66
-
67
-
68
-
69
-
70
-
71
-
72
-
73
-
74
-
75
-
76
-
77
-
78
-
79
-
80
-
81
-
82
-
83
-
84
-
85
-
86
-
87
-
88
-
89
-
90
-
91
-
92
-
93
-
94
-
95
-
96
-
97
-
98
-
99
-
100
-
101
-
102
-
103
-
104
-
105
-
106
-
107
-
108
-
109
-
110
-
111
-
112
-
113
-
114
-
115
-
116
-
117
-
118
-
119
-
120
-
121
-
122
-
123
-
124
-
125
-
126
-
127
-
128
-
129
-
130
-
131
-
132
-
133
-
134
-
135
-
136
-
137
-
138
-
139
-
140
-
141
-
142
-
143
-
144
-
145
-
146
-
147
-
148
-
149
-
150
-
151
-
152
-
153
-
154
-
155
-
156
-
157
-
158
-
159
-
160
-
161
-
162
-
163
-
164
-
165
-
166
-
167
-
168
-
169
-
170
-
171
-
172
-
173
-
174
-
175
-
176
-
177
-
178
-
179
-
180
-
181
-
182
-
183
-
184
-
185
-
186
-
187
-
188
-
189
-
190
-
191
-
192
-
193
-
194
-
195
-
196
-
197
-
198
-
199
-
200
-
201
-
202
-
203
-
204
-
205
-
206
-
207
-
208
-
209
-
210
-
211
-
212
-
213
-
214
-
215
-
216
 |
 |

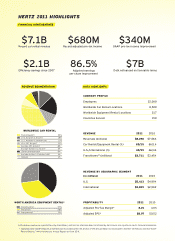
REVENUE 2011 2010
Revenues (millions) $8,298 $7,563
Car Rental/Equipment Rental (%) 85/15 86/14
U.S./International (%) 65/35 66/34
Franchisees(a) (millions) $3,711 $3,454
DATA HIGHLIGHTS
FINANCIAL ACHIEVEMENTS
(a) Franchise revenue as reported to us by franchisees, and has not otherwise been confirmed by Hertz and is not reported in Hertz financial statements.
* Indicates a Non-GAAP measure presented and reconciled within the section of the Annual Report to Stockholders entitled “Definitions and Non-GAAP
Reconciliations,” which follows our Annual Report on Form 10–K.
HERTZ 2011 HIGHLIGHTS
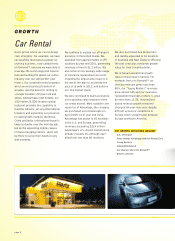
Record car rental revenue
$7.1B
Record adjusted pre-tax income
$680M
GAAP pre-tax income improvement
$340M
Efficiency savings since 2007
$2.1B
Adjusted earnings
per share improvement
86.5%
Debt refinanced on favorable terms
$7B
Franchisees(a) 34%
U.S. Airport (Leisure) 18%
U.S. Airport (Commercial) 13%
U.S. Off Airport 11%
Europe Off Airport 8%
Europe Airport (Leisure) 6%
Donlen 1%
Other Internationa
l6
%
Europe Airport (Commercial) 3%
REVENUE SEGMENTATION
WORLDWIDE CAR RENTAL
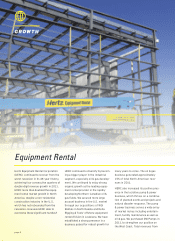
Construction 37%
Industrial 28%
Fragmented 35%
NORTH AMERICA EQUIPMENT RENTAL* PROFITABILITY 2011 2010
Adjusted Pre-Tax Margin* 8.2% 4.6%
Adjusted EPS* $0.97 $0.52
REVENUE BY GEOGRAPHIC SEGMENT
(in millions) 2011 2010
U.S. $5,413 $4,994
International $2,885 $2,569
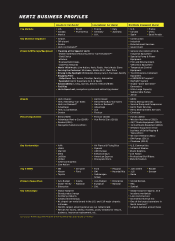
COMPANY PROFILE
Employees 32,000
Worldwide Car Rental Locations 8,500
Worldwide Equipment Rental Locations 317
Countries Served 150