Hertz 2011 Annual Report Download - page 86
Download and view the complete annual report
Please find page 86 of the 2011 Hertz annual report below. You can navigate through the pages in the report by either clicking on the pages listed below, or by using the keyword search tool below to find specific information within the annual report.-
 1
1 -
2
-
3
-
4
-
5
-
6
-
7
-
8
-
9
-
10
-
11
-
12
-
13
-
14
-
15
-
16
-
17
-
18
-
19
-
20
-
21
-
22
-
23
-
24
-
25
-
26
-
27
-
28
-
29
-
30
-
31
-
32
-
33
-
34
-
35
-
36
-
37
-
38
-
39
-
40
-
41
-
42
-
43
-
44
-
45
-
46
-
47
-
48
-
49
-
50
-
51
-
52
-
53
-
54
-
55
-
56
-
57
-
58
-
59
-
60
-
61
-
62
-
63
-
64
-
65
-
66
-
67
-
68
-
69
-
70
-
71
-
72
-
73
-
74
-
75
-
 76
76 -
 77
77 -
 78
78 -
 79
79 -
 80
80 -
 81
81 -
 82
82 -
 83
83 -
 84
84 -
 85
85 -
 86
86 -
 87
87 -
 88
88 -
 89
89 -
 90
90 -
 91
91 -
 92
92 -
 93
93 -
 94
94 -
 95
95 -
 96
96 -
97
-
98
-
99
-
100
-
101
-
102
-
103
-
104
-
105
-
106
-
107
-
108
-
109
-
110
-
111
-
112
-
113
-
114
-
115
-
116
-
117
-
118
-
119
-
120
-
121
-
122
-
123
-
124
-
125
-
126
-
127
-
128
-
129
-
130
-
131
-
132
-
133
-
134
-
135
-
136
-
137
-
138
-
139
-
140
-
141
-
142
-
143
-
144
-
145
-
146
-
147
-
148
-
149
-
150
-
151
-
152
-
153
-
154
-
155
-
156
-
157
-
158
-
159
-
160
-
161
-
162
-
163
-
164
-
165
-
166
-
167
-
168
-
169
-
170
-
171
-
172
-
173
-
174
-
175
-
176
-
177
-
178
-
179
-
180
-
181
-
182
-
183
-
184
-
185
-
186
-
187
-
188
-
189
-
190
-
191
-
192
-
193
-
194
-
195
-
196
-
197
-
198
-
199
-
200
-
201
-
202
-
203
-
204
-
205
-
206
-
207
-
208
-
209
-
210
-
211
-
212
-
213
-
214
-
215
-
216
 |
 |

ITEM 7. MANAGEMENT’S DISCUSSION AND ANALYSIS OF FINANCIAL CONDITION AND
RESULTS OF OPERATIONS (Continued)
incurred to facilitate business process re-engineering initiatives that involve significant organization redesign and
extensive operational process changes.
(5) Represents a gain (net of transaction costs) recorded in connection with the buyback of portions of certain of our
Senior Notes and Senior Subordinated Notes.
(6) Represents an allowance for uncollectible program car receivables related to a bankrupt European dealer affiliated with
a U.S. car manufacturer.
(7) Represents a gain for the U.K. pension plan relating to unamortized prior service cost from a 2010 amendment that
eliminated discretionary pension increases related to pre-1997 service primarily pertaining to inactive employees.
(8) Represents premiums paid to redeem our 10.5% Senior Subordinated Notes and a portion of our 8.875% Senior Notes.
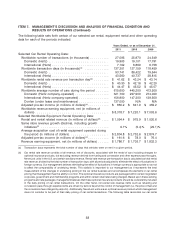
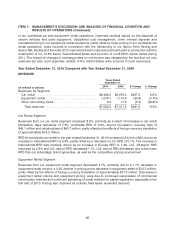
(d) Equipment rental and rental related revenue consists of all revenue, net of discounts, associated with the rental of equipment
including charges for delivery, loss damage waivers and fueling, but excluding revenue arising from the sale of equipment,
parts and supplies and certain other ancillary revenue. Rental and rental related revenue is adjusted in all periods to eliminate
the effect of fluctuations in foreign currency. Our management believes eliminating the effect of fluctuations in foreign
currency is appropriate so as not to affect the comparability of underlying trends. This statistic is important to our
management as it is utilized in the measurement of rental revenue generated per dollar invested in fleet on an annualized
basis and is comparable with the reporting of other industry participants. The following table reconciles our equipment rental
revenue to our equipment rental and rental related revenue (based on December 31, 2010 foreign exchange rates) for the
years ended December 31, 2011, 2010 and 2009 (in millions of dollars):
Years ended December 31,
2011 2010 2009
Equipment rental segment revenues ........................... $1,209.5 $1,070.1 $1,110.9
Equipment sales and other revenue ............................ (106.2) (100.1) (109.8)
Foreign currency adjustment ................................ (8.9) 5.9 19.5
Rental and rental related revenue ............................. $1,094.4 $ 975.9 $1,020.6
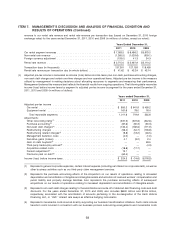
(e) Same store revenue growth or decline is calculated as the year over year change in revenue for locations that are open at the
end of the period reported and have been operating under our direction for more than twelve months. The same store
revenue amounts are adjusted in all periods to eliminate the effect of fluctuations in foreign currency. Our management
believes eliminating the effect of fluctuations in foreign currency is appropriate so as not to affect the comparability of
underlying trends.
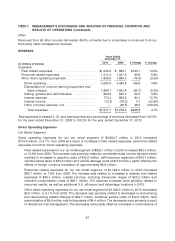
Year Ended December 31, 2011 Compared with Year Ended December 31, 2010
REVENUES
Years Ended
December 31,
2011 2010 $ Change % Change
(in millions of dollars)
Revenues by Segment:
Car rental ................................ $7,083.5 $6,486.2 $597.3 9.2%
Equipment rental ........................... 1,209.5 1,070.1 139.4 13.0%
Other reconciling items ...................... 5.4 6.2 (0.8) (12.5)%
Total revenues ........................... $8,298.4 $7,562.5 $735.9 9.7%
Car Rental Segment
Revenues from our car rental segment increased 9.2%, primarily as a result of increases in car rental
transaction days worldwide of 8.0%, refueling fees of $40.3 million and airport concession recovery fees
60