Hertz 2011 Annual Report Download - page 85
Download and view the complete annual report
Please find page 85 of the 2011 Hertz annual report below. You can navigate through the pages in the report by either clicking on the pages listed below, or by using the keyword search tool below to find specific information within the annual report.-
 1
1 -
2
-
3
-
4
-
5
-
6
-
7
-
8
-
9
-
10
-
11
-
12
-
13
-
14
-
15
-
16
-
17
-
18
-
19
-
20
-
21
-
22
-
23
-
24
-
25
-
26
-
27
-
28
-
29
-
30
-
31
-
32
-
33
-
34
-
35
-
36
-
37
-
38
-
39
-
40
-
41
-
42
-
43
-
44
-
45
-
46
-
47
-
48
-
49
-
50
-
51
-
52
-
53
-
54
-
55
-
56
-
57
-
58
-
59
-
60
-
61
-
62
-
63
-
64
-
65
-
66
-
67
-
68
-
69
-
70
-
71
-
72
-
73
-
74
-
 75
75 -
 76
76 -
 77
77 -
 78
78 -
 79
79 -
 80
80 -
 81
81 -
 82
82 -
 83
83 -
 84
84 -
 85
85 -
 86
86 -
 87
87 -
 88
88 -
 89
89 -
 90
90 -
 91
91 -
 92
92 -
 93
93 -
 94
94 -
 95
95 -
96
-
97
-
98
-
99
-
100
-
101
-
102
-
103
-
104
-
105
-
106
-
107
-
108
-
109
-
110
-
111
-
112
-
113
-
114
-
115
-
116
-
117
-
118
-
119
-
120
-
121
-
122
-
123
-
124
-
125
-
126
-
127
-
128
-
129
-
130
-
131
-
132
-
133
-
134
-
135
-
136
-
137
-
138
-
139
-
140
-
141
-
142
-
143
-
144
-
145
-
146
-
147
-
148
-
149
-
150
-
151
-
152
-
153
-
154
-
155
-
156
-
157
-
158
-
159
-
160
-
161
-
162
-
163
-
164
-
165
-
166
-
167
-
168
-
169
-
170
-
171
-
172
-
173
-
174
-
175
-
176
-
177
-
178
-
179
-
180
-
181
-
182
-
183
-
184
-
185
-
186
-
187
-
188
-
189
-
190
-
191
-
192
-
193
-
194
-
195
-
196
-
197
-
198
-
199
-
200
-
201
-
202
-
203
-
204
-
205
-
206
-
207
-
208
-
209
-
210
-
211
-
212
-
213
-
214
-
215
-
216
 |
 |

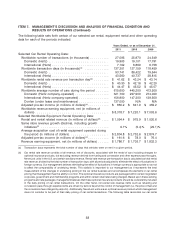
ITEM 7. MANAGEMENT’S DISCUSSION AND ANALYSIS OF FINANCIAL CONDITION AND
RESULTS OF OPERATIONS (Continued)
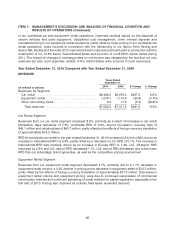
revenue to our rental rate revenue and rental rate revenue per transaction day (based on December 31, 2010 foreign
exchange rates) for the years ended December 31, 2011, 2010 and 2009 (in millions of dollars, except as noted):
Years Ended December 31,
2011 2010 2009
Car rental segment revenues ............................... $7,083.5 $ 6,486.2 $5,979.0
Non-rental rate revenue .................................. (1,265.5) (1,029.6) (903.1)
Foreign currency adjustment ............................... (103.0) 41.3 34.3
Rental rate revenue ..................................... $5,715.0 $ 5,497.9 $5,110.2
Transaction days (in thousands) ............................. 137,301 127,159 118,459
Rental rate revenue per transaction day (in whole dollars) ............. $ 41.62 $ 43.24 $ 43.14
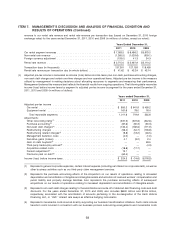
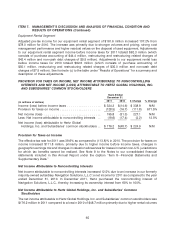
(c) Adjusted pre-tax income is calculated as income (loss) before income taxes plus non-cash purchase accounting charges,
non-cash debt charges and certain one-time charges and non-operational items. Adjusted pre-tax income is the measure
utilized by management in making decisions about allocating resources to segments and measuring their performance.
Management believes this measure best reflects the financial results from ongoing operations. The following table reconciles
income (loss) before income taxes by segment to adjusted pre-tax income by segment for the years ended December 31,
2011, 2010 and 2009 (in millions of dollars):
Years ended December 31,
2011 2010 2009
Adjusted pre-tax income ....................................
Car rental ............................................ $ 850.2 $ 641.9 $ 459.2
Equipment rental ....................................... 161.6 78.0 76.4
Total reportable segments ................................ 1,011.8 719.9 535.6
Adjustments:
Other reconciling items(1) .................................. (331.3) (372.8) (342.6)
Purchase accounting(2) .................................... (87.6) (90.3) (90.3)
Non-cash debt charges(3) .................................. (130.4) (182.6) (171.9)
Restructuring charges .................................... (56.4) (54.7) (106.8)
Restructuring related charges(4) .............................. (9.8) (13.2) (46.5)
Management transition costs ................................ (4.0) — (1.0)
Derivative gains (losses) ................................... 0.1 (3.2) 2.4
Gain on debt buyback(5) ................................... — — 48.5
Third-party bankruptcy accrual(6) .............................. — — (4.3)
Acquisition related costs ................................... (18.8) (17.7) —
Pension adjustment(7) ..................................... 13.1 — —
Premiums paid on debt(8) .................................. (62.4) — —
Income (loss) before income taxes .............................. $ 324.3 $ (14.6) $(176.9)
(1) Represents general corporate expenses, certain interest expense (including net interest on corporate debt), as well as
other business activities such as our third-party claim management services.
(2) Represents the purchase accounting effects of the Acquisition on our results of operations relating to increased
depreciation and amortization of tangible and intangible assets and accretion of revalued workers’ compensation and
public liability and property damage liabilities. Also represents the purchase accounting effects of subsequent
acquisitions on our results of operations relating to increased depreciation and amortization of intangible assets.
(3) Represents non-cash debt charges relating to the amortization and write-off of deferred debt financing costs and debt
discounts. For the years ended December 31, 2010 and 2009, also includes $68.9 million and $74.6 million,
respectively, associated with the amortization of amounts pertaining to the de-designation of the Hertz Vehicle
Financing LLC, or ‘‘HVF,’’ interest rate swaps as effective hedging instruments.
(4) Represents incremental costs incurred directly supporting our business transformation initiatives. Such costs include
transition costs incurred in connection with our business process outsourcing arrangements and incremental costs
59