Hertz 2011 Annual Report Download - page 92
Download and view the complete annual report
Please find page 92 of the 2011 Hertz annual report below. You can navigate through the pages in the report by either clicking on the pages listed below, or by using the keyword search tool below to find specific information within the annual report.-
 1
1 -
2
-
3
-
4
-
5
-
6
-
7
-
8
-
9
-
10
-
11
-
12
-
13
-
14
-
15
-
16
-
17
-
18
-
19
-
20
-
21
-
22
-
23
-
24
-
25
-
26
-
27
-
28
-
29
-
30
-
31
-
32
-
33
-
34
-
35
-
36
-
37
-
38
-
39
-
40
-
41
-
42
-
43
-
44
-
45
-
46
-
47
-
48
-
49
-
50
-
51
-
52
-
53
-
54
-
55
-
56
-
57
-
58
-
59
-
60
-
61
-
62
-
63
-
64
-
65
-
66
-
67
-
68
-
69
-
70
-
71
-
72
-
73
-
74
-
75
-
76
-
77
-
78
-
79
-
80
-
81
-
 82
82 -
 83
83 -
 84
84 -
 85
85 -
 86
86 -
 87
87 -
 88
88 -
 89
89 -
 90
90 -
 91
91 -
 92
92 -
 93
93 -
 94
94 -
 95
95 -
 96
96 -
 97
97 -
 98
98 -
 99
99 -
 100
100 -
 101
101 -
 102
102 -
103
-
104
-
105
-
106
-
107
-
108
-
109
-
110
-
111
-
112
-
113
-
114
-
115
-
116
-
117
-
118
-
119
-
120
-
121
-
122
-
123
-
124
-
125
-
126
-
127
-
128
-
129
-
130
-
131
-
132
-
133
-
134
-
135
-
136
-
137
-
138
-
139
-
140
-
141
-
142
-
143
-
144
-
145
-
146
-
147
-
148
-
149
-
150
-
151
-
152
-
153
-
154
-
155
-
156
-
157
-
158
-
159
-
160
-
161
-
162
-
163
-
164
-
165
-
166
-
167
-
168
-
169
-
170
-
171
-
172
-
173
-
174
-
175
-
176
-
177
-
178
-
179
-
180
-
181
-
182
-
183
-
184
-
185
-
186
-
187
-
188
-
189
-
190
-
191
-
192
-
193
-
194
-
195
-
196
-
197
-
198
-
199
-
200
-
201
-
202
-
203
-
204
-
205
-
206
-
207
-
208
-
209
-
210
-
211
-
212
-
213
-
214
-
215
-
216
 |
 |

ITEM 7. MANAGEMENT’S DISCUSSION AND ANALYSIS OF FINANCIAL CONDITION AND
RESULTS OF OPERATIONS (Continued)
in our worldwide car and equipment rental operations, improved residual values on the disposal of
certain vehicles and used equipment, disciplined cost management, lower interest expense and
increased pricing in our equipment rental operations, partly offset by lower pricing in our worldwide car
rental operations, costs incurred in connection with the refinancing of our Senior Term Facility and
Senior ABL Facility and the write-off of unamortized debt costs and premiums paid in connection with the
redemption of our 10.5% Senior Subordinated Notes and a portion of our 8.875% Senior Notes during
2011. The impact of changes in exchange rates on net income was mitigated by the fact that not only
revenues but also most expenses outside of the United States were incurred in local currencies.
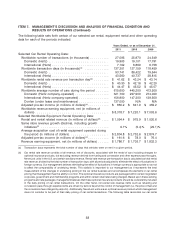
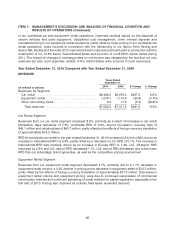
Year Ended December 31, 2010 Compared with Year Ended December 31, 2009
REVENUES
Years Ended
December 31,
2010 2009 $ Change % Change
(in millions of dollars)
Revenues by Segment:
Car rental ................................ $6,486.2 $5,979.0 $507.2 8.5%
Equipment rental ........................... 1,070.1 1,110.9 (40.8) (3.7)%
Other reconciling items ...................... 6.2 11.6 (5.4) (46.6)%
Total revenues ........................... $7,562.5 $7,101.5 $461.0 6.5%
Car Rental Segment
Revenues from our car rental segment increased 8.5%, primarily as a result of increases in car rental
transaction days worldwide of 7.3%, worldwide RPD of 0.2%, airport concession recovery fees of
$49.1 million and refueling fees of $43.7 million, partly offset by the effects of foreign currency translation
of approximately $18.2 million.
RPD for worldwide car rental for the year ended December 31, 2010 increased 0.2% from 2009, due to an
increase in International RPD of 0.9%, partly offset by a decrease in U.S. RPD of 0.1%. The increase in
International RPD was primarily driven by an increase in Europe RPD of 1.4%. U.S. off-airport RPD
improved by 2.9% and U.S. airport RPD decreased 1.1%. U.S. airport RPD decreased due to the lower
RPD that our Advantage brand generates, as well as the competitive pricing environment.
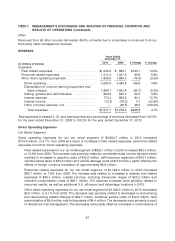
Equipment Rental Segment
Revenues from our equipment rental segment decreased 3.7%, primarily due to a 1.7% decrease in
equipment rental volume, a 4.2% decline in pricing and a decrease in equipment sales of $12.3 million,
partly offset by the effects of foreign currency translation of approximately $17.3 million. Decreases in
equipment rental volume and equipment pricing, were due to continued suppression of commercial
construction markets and continued tightening of credit markets for capital expansion, especially in the
first half of 2010. Pricing also declined as industry fleet levels exceeded demand.
66