HSBC 2008 Annual Report Download - page 96
Download and view the complete annual report
Please find page 96 of the 2008 HSBC annual report below. You can navigate through the pages in the report by either clicking on the pages listed below, or by using the keyword search tool below to find specific information within the annual report.-
 1
1 -
2
-
3
-
4
-
5
-
6
-
7
-
8
-
9
-
10
-
11
-
12
-
13
-
14
-
15
-
16
-
17
-
18
-
19
-
20
-
21
-
22
-
23
-
24
-
25
-
26
-
27
-
28
-
29
-
30
-
31
-
32
-
33
-
34
-
35
-
36
-
37
-
38
-
39
-
40
-
41
-
42
-
43
-
44
-
45
-
46
-
47
-
48
-
49
-
50
-
51
-
52
-
53
-
54
-
55
-
56
-
57
-
58
-
59
-
60
-
61
-
62
-
63
-
64
-
65
-
66
-
67
-
68
-
69
-
70
-
71
-
72
-
73
-
74
-
75
-
76
-
77
-
78
-
79
-
80
-
81
-
82
-
83
-
84
-
85
-
 86
86 -
 87
87 -
 88
88 -
 89
89 -
 90
90 -
 91
91 -
 92
92 -
 93
93 -
 94
94 -
 95
95 -
 96
96 -
 97
97 -
 98
98 -
 99
99 -
 100
100 -
 101
101 -
 102
102 -
 103
103 -
 104
104 -
 105
105 -
 106
106 -
107
-
108
-
109
-
110
-
111
-
112
-
113
-
114
-
115
-
116
-
117
-
118
-
119
-
120
-
121
-
122
-
123
-
124
-
125
-
126
-
127
-
128
-
129
-
130
-
131
-
132
-
133
-
134
-
135
-
136
-
137
-
138
-
139
-
140
-
141
-
142
-
143
-
144
-
145
-
146
-
147
-
148
-
149
-
150
-
151
-
152
-
153
-
154
-
155
-
156
-
157
-
158
-
159
-
160
-
161
-
162
-
163
-
164
-
165
-
166
-
167
-
168
-
169
-
170
-
171
-
172
-
173
-
174
-
175
-
176
-
177
-
178
-
179
-
180
-
181
-
182
-
183
-
184
-
185
-
186
-
187
-
188
-
189
-
190
-
191
-
192
-
193
-
194
-
195
-
196
-
197
-
198
-
199
-
200
-
201
-
202
-
203
-
204
-
205
-
206
-
207
-
208
-
209
-
210
-
211
-
212
-
213
-
214
-
215
-
216
-
217
-
218
-
219
-
220
-
221
-
222
-
223
-
224
-
225
-
226
-
227
-
228
-
229
-
230
-
231
-
232
-
233
-
234
-
235
-
236
-
237
-
238
-
239
-
240
-
241
-
242
-
243
-
244
-
245
-
246
-
247
-
248
-
249
-
250
-
251
-
252
-
253
-
254
-
255
-
256
-
257
-
258
-
259
-
260
-
261
-
262
-
263
-
264
-
265
-
266
-
267
-
268
-
269
-
270
-
271
-
272
-
273
-
274
-
275
-
276
-
277
-
278
-
279
-
280
-
281
-
282
-
283
-
284
-
285
-
286
-
287
-
288
-
289
-
290
-
291
-
292
-
293
-
294
-
295
-
296
-
297
-
298
-
299
-
300
-
301
-
302
-
303
-
304
-
305
-
306
-
307
-
308
-
309
-
310
-
311
-
312
-
313
-
314
-
315
-
316
-
317
-
318
-
319
-
320
-
321
-
322
-
323
-
324
-
325
-
326
-
327
-
328
-
329
-
330
-
331
-
332
-
333
-
334
-
335
-
336
-
337
-
338
-
339
-
340
-
341
-
342
-
343
-
344
-
345
-
346
-
347
-
348
-
349
-
350
-
351
-
352
-
353
-
354
-
355
-
356
-
357
-
358
-
359
-
360
-
361
-
362
-
363
-
364
-
365
-
366
-
367
-
368
-
369
-
370
-
371
-
372
-
373
-
374
-
375
-
376
-
377
-
378
-
379
-
380
-
381
-
382
-
383
-
384
-
385
-
386
-
387
-
388
-
389
-
390
-
391
-
392
-
393
-
394
-
395
-
396
-
397
-
398
-
399
-
400
-
401
-
402
-
403
-
404
-
405
-
406
-
407
-
408
-
409
-
410
-
411
-
412
-
413
-
414
-
415
-
416
-
417
-
418
-
419
-
420
-
421
-
422
-
423
-
424
-
425
-
426
-
427
-
428
-
429
-
430
-
431
-
432
-
433
-
434
-
435
-
436
-
437
-
438
-
439
-
440
-
441
-
442
-
443
-
444
-
445
-
446
-
447
-
448
-
449
-
450
-
451
-
452
-
453
-
454
-
455
-
456
-
457
-
458
-
459
-
460
-
461
-
462
-
463
-
464
-
465
-
466
-
467
-
468
-
469
-
470
-
471
-
472
 |
 |

HSBC HOLDINGS PLC
Report of the Directors: Operating and Financial Review (continued)
Geographical regions > Europe > 2007
94
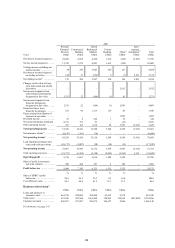
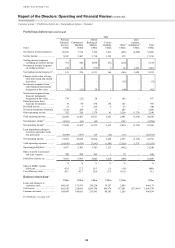
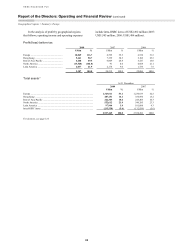
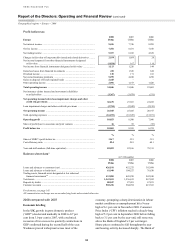
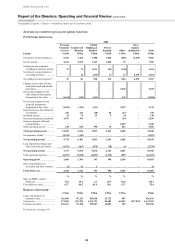
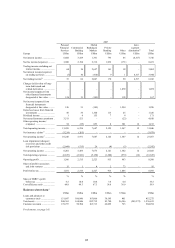
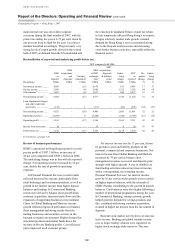
Reconciliation of reported and underlying profit before tax
2007 compared with 2006
Europe
2006
as
reported
US$m
2006
acquisitions
and
disposals1
US$m
Currency
translation2
US$m
2006
at 2007
exchange
rates6
US$m
2007
acquisitions,
disposals
& dilution
gains1
US$m
Under-
lying
change
US$m
2007
as
reported
US$m
Re-
ported
change
%
Under-
lying
change
%
Net interest income .......... 8,289 (3) 635 8,921 419 (1,594) 7,746 (7) (18)
Net fee income ................. 7,108 53 586 7,747 (133) 817 8,431 19 11
Other income4 .................. 7,675 (53) 576 8,198 (90) 3,282 11,390 48 40
Net operating income5 ..... 23,072 (3) 1,797 24,866 196 2,505 27,567 19 10
Loan impairment charges
and other credit risk
provisions .................... (2,155) – (147) (2,302) – (240) (2,542) (18) (10)
Net operating income ...... 20,917 (3) 1,650 22,564 196 2,265 25,025 20 10
Operating expenses .......... (13,871) 2 (1,076) (14,945) (51) (1,529) (16,525) (19) (10)
Operating profit ............... 7,046 (1) 574 7,619 145 736 8,500 21 10
Income/(expense) from
associates ......................... (72) – (6) (78) (50) 223 95
232 286
Profit before tax ............... 6,974 (1) 568 7,541 95 959 8,595 23 13
For footnotes, see page 143.
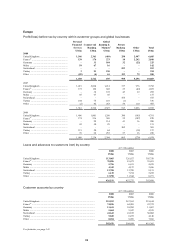
In Commercial Banking, growth in deposit and
lending balances in the UK and ongoing business
expansion in Turkey and Malta led to steady growth
in revenues. This was partly offset by increased loan
impairment charges and higher costs associated with
business expansion. In Global Banking and Markets,
higher income from most businesses was offset by
trading losses in Credit and Rates and increased
costs. Strong profit growth in Private Banking
was driven by an increased client appetite for
discretionary portfolios, a rise in lending volumes
and further improvements in cross-referrals. In
Personal Financial Services, a fall in pre-tax profits
reflected ex gratia payments expensed in respect of
overdraft fees applied in previous years and a
provision for reimbursement of certain charges on
historic will trusts and other related services. The
‘Other’ segment benefited from a US$1.3 billion fair
value gain in HSBC’s own debt.
Net interest income declined by 18 per cent,
mainly because the expansion of trading activities in
both the UK and France resulted in higher funding
costs, with the related revenues reported in the
trading income line. This was partly offset by higher
net interest income in the personal and commercial
businesses.
In the UK, Personal Financial Services’
spreads widened in a rising interest rate environment
and competitive pricing attracted higher balances.
This was mitigated by lower spreads on mortgages
as customers switched to fixed rate products. In
Commercial Banking, higher net interest income
was largely driven by growth in the UK, Turkey,
Germany and Malta. In the UK, a negotiated rate
deposit product launched in previous years continued
to be instrumental in driving higher deposit balances.
Strong growth in corporate and structured banking
for micro customers, together with expansion in
lending to small and mid-market customers,
contributed to higher lending balances although this
benefit was partially constrained by spread
compression in the competitive market.
Revenues from transactional balances held
within the payments and cash management business
increased by 13 per cent, as credit market dislocation
in the second half of the year caused customers to
hold higher cash balances. After several years of
decline, balance sheet management revenues in
Europe increased.
In Turkey, higher net interest income was driven
by new customer acquisition. In Switzerland, the
Private Banking business earned higher net interest
income from lending to existing clients as they
further leveraged their portfolios.
Net fee income rose by 11 per cent. Account
services increased on higher customer balances and
volumes of transactions in the UK and France,
supported by sales of fee-earning packaged accounts.
Card fees increased in the UK, mainly on
interchange and acquiring fees, and in Turkey, on
interchange and cash advance fees. This was partly
offset by a reduction in credit card default fees in the