HSBC 2008 Annual Report Download - page 138
Download and view the complete annual report
Please find page 138 of the 2008 HSBC annual report below. You can navigate through the pages in the report by either clicking on the pages listed below, or by using the keyword search tool below to find specific information within the annual report.-
 1
1 -
2
-
3
-
4
-
5
-
6
-
7
-
8
-
9
-
10
-
11
-
12
-
13
-
14
-
15
-
16
-
17
-
18
-
19
-
20
-
21
-
22
-
23
-
24
-
25
-
26
-
27
-
28
-
29
-
30
-
31
-
32
-
33
-
34
-
35
-
36
-
37
-
38
-
39
-
40
-
41
-
42
-
43
-
44
-
45
-
46
-
47
-
48
-
49
-
50
-
51
-
52
-
53
-
54
-
55
-
56
-
57
-
58
-
59
-
60
-
61
-
62
-
63
-
64
-
65
-
66
-
67
-
68
-
69
-
70
-
71
-
72
-
73
-
74
-
75
-
76
-
77
-
78
-
79
-
80
-
81
-
82
-
83
-
84
-
85
-
86
-
87
-
88
-
89
-
90
-
91
-
92
-
93
-
94
-
95
-
96
-
97
-
98
-
99
-
100
-
101
-
102
-
103
-
104
-
105
-
106
-
107
-
108
-
109
-
110
-
111
-
112
-
113
-
114
-
115
-
116
-
117
-
118
-
119
-
120
-
121
-
122
-
123
-
124
-
125
-
126
-
127
-
 128
128 -
 129
129 -
 130
130 -
 131
131 -
 132
132 -
 133
133 -
 134
134 -
 135
135 -
 136
136 -
 137
137 -
 138
138 -
 139
139 -
 140
140 -
 141
141 -
 142
142 -
 143
143 -
 144
144 -
 145
145 -
 146
146 -
 147
147 -
 148
148 -
149
-
150
-
151
-
152
-
153
-
154
-
155
-
156
-
157
-
158
-
159
-
160
-
161
-
162
-
163
-
164
-
165
-
166
-
167
-
168
-
169
-
170
-
171
-
172
-
173
-
174
-
175
-
176
-
177
-
178
-
179
-
180
-
181
-
182
-
183
-
184
-
185
-
186
-
187
-
188
-
189
-
190
-
191
-
192
-
193
-
194
-
195
-
196
-
197
-
198
-
199
-
200
-
201
-
202
-
203
-
204
-
205
-
206
-
207
-
208
-
209
-
210
-
211
-
212
-
213
-
214
-
215
-
216
-
217
-
218
-
219
-
220
-
221
-
222
-
223
-
224
-
225
-
226
-
227
-
228
-
229
-
230
-
231
-
232
-
233
-
234
-
235
-
236
-
237
-
238
-
239
-
240
-
241
-
242
-
243
-
244
-
245
-
246
-
247
-
248
-
249
-
250
-
251
-
252
-
253
-
254
-
255
-
256
-
257
-
258
-
259
-
260
-
261
-
262
-
263
-
264
-
265
-
266
-
267
-
268
-
269
-
270
-
271
-
272
-
273
-
274
-
275
-
276
-
277
-
278
-
279
-
280
-
281
-
282
-
283
-
284
-
285
-
286
-
287
-
288
-
289
-
290
-
291
-
292
-
293
-
294
-
295
-
296
-
297
-
298
-
299
-
300
-
301
-
302
-
303
-
304
-
305
-
306
-
307
-
308
-
309
-
310
-
311
-
312
-
313
-
314
-
315
-
316
-
317
-
318
-
319
-
320
-
321
-
322
-
323
-
324
-
325
-
326
-
327
-
328
-
329
-
330
-
331
-
332
-
333
-
334
-
335
-
336
-
337
-
338
-
339
-
340
-
341
-
342
-
343
-
344
-
345
-
346
-
347
-
348
-
349
-
350
-
351
-
352
-
353
-
354
-
355
-
356
-
357
-
358
-
359
-
360
-
361
-
362
-
363
-
364
-
365
-
366
-
367
-
368
-
369
-
370
-
371
-
372
-
373
-
374
-
375
-
376
-
377
-
378
-
379
-
380
-
381
-
382
-
383
-
384
-
385
-
386
-
387
-
388
-
389
-
390
-
391
-
392
-
393
-
394
-
395
-
396
-
397
-
398
-
399
-
400
-
401
-
402
-
403
-
404
-
405
-
406
-
407
-
408
-
409
-
410
-
411
-
412
-
413
-
414
-
415
-
416
-
417
-
418
-
419
-
420
-
421
-
422
-
423
-
424
-
425
-
426
-
427
-
428
-
429
-
430
-
431
-
432
-
433
-
434
-
435
-
436
-
437
-
438
-
439
-
440
-
441
-
442
-
443
-
444
-
445
-
446
-
447
-
448
-
449
-
450
-
451
-
452
-
453
-
454
-
455
-
456
-
457
-
458
-
459
-
460
-
461
-
462
-
463
-
464
-
465
-
466
-
467
-
468
-
469
-
470
-
471
-
472
 |
 |

HSBC HOLDINGS PLC
Report of the Directors: Operating and Financial Review (continued)
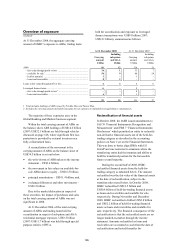
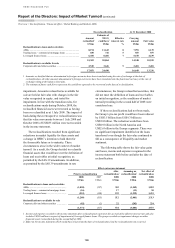
Geographical regions > Latin America > Profit/(loss) before tax by customer group
136
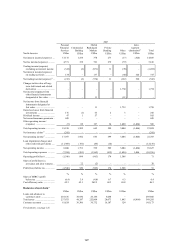
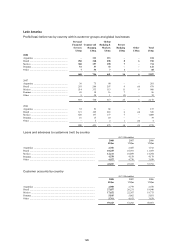
Analysis by customer group and global business (continued)
Profit/(loss) before tax
2007
Latin America
Personal
Financial
Services
US$m
Commercial
Banking
US$m
Global
Banking &
Markets
US$m
Private
Banking
US$m
Other
US$m
Inter-
segment
elimination21
US$m
Total
US$m
Net interest income ..................... 3,983 1,407 410 20 3 (247) 5,576
Net fee income ............................ 1,372 485 250 40 6 – 2,153
Trading income excluding net
interest income ....................... 67 39 164 2 – – 272
Net interest income on
trading activities ..................... 10 1 18 – – 247 276
Net trading income16 ................... 77 40 182 2 – 247 548
Changes in fair value of long-
term debt issued and
related derivatives .................. – – – – – – –
Net income from other financial
instruments designated at fair
value ....................................... 314 – 6 – – – 320
Net income from financial
instruments designated at
fair value ................................. 314 – 6 – – – 320
Gains less losses from financial
investments ............................. 120 51 82 1 (1) – 253
Gains arising from dilution of
interests in associates ............. – – – – 11 – 11
Dividend income ......................... 5 2 2 – – – 9
Net earned insurance premiums . 1,448 66 80 – – – 1,594
Other operating income .............. 145 69 31 8 12 (37) 228
Total operating income ............... 7,464 2,120 1,043 71 31 (37) 10,692
Net insurance claims17 ................ (1,330) (37) (60) – – – (1,427)
Net operating income5 ................ 6,134 2,083 983 71 31 (37) 9,265
Loan impairment (charges)/
recoveries and other credit
risk provisions ........................ (1,492) (212) 13 – (6) – (1,697)
Net operating income ................. 4,642 1,871 996 71 25 (37) 7,568
Total operating expenses ............ (3,758) (1,132) (481) (46) (22) 37 (5,402)
Operating profit .......................... 884 739 515 25 3 – 2,166
Share of profit in associates
and joint ventures ................... 9 1 2 – – – 12
Profit before tax .......................... 893 740 517 25 3 – 2,178
% % % % % %
Share of HSBC’s profit
before tax ................................ 3.7 3.1 2.1 0.1 – 9.0
Cost efficiency ratio ................... 61.3 54.3 48.9 64.8 71.0 58.3
Balance sheet data15
US$m US$m US$m US$m US$m US$m
Loans and advances to
customers (net) ....................... 21,680 16,243 9,935 65 – 47,923
Total assets ................................. 35,181 21,049 45,045 302 261 (750) 101,088
Customer accounts ...................... 30,628 15,524 13,950 1,190 – 61,292
For footnotes, see page 143.