HSBC 2008 Annual Report Download - page 406
Download and view the complete annual report
Please find page 406 of the 2008 HSBC annual report below. You can navigate through the pages in the report by either clicking on the pages listed below, or by using the keyword search tool below to find specific information within the annual report.-
 1
1 -
2
-
3
-
4
-
5
-
6
-
7
-
8
-
9
-
10
-
11
-
12
-
13
-
14
-
15
-
16
-
17
-
18
-
19
-
20
-
21
-
22
-
23
-
24
-
25
-
26
-
27
-
28
-
29
-
30
-
31
-
32
-
33
-
34
-
35
-
36
-
37
-
38
-
39
-
40
-
41
-
42
-
43
-
44
-
45
-
46
-
47
-
48
-
49
-
50
-
51
-
52
-
53
-
54
-
55
-
56
-
57
-
58
-
59
-
60
-
61
-
62
-
63
-
64
-
65
-
66
-
67
-
68
-
69
-
70
-
71
-
72
-
73
-
74
-
75
-
76
-
77
-
78
-
79
-
80
-
81
-
82
-
83
-
84
-
85
-
86
-
87
-
88
-
89
-
90
-
91
-
92
-
93
-
94
-
95
-
96
-
97
-
98
-
99
-
100
-
101
-
102
-
103
-
104
-
105
-
106
-
107
-
108
-
109
-
110
-
111
-
112
-
113
-
114
-
115
-
116
-
117
-
118
-
119
-
120
-
121
-
122
-
123
-
124
-
125
-
126
-
127
-
128
-
129
-
130
-
131
-
132
-
133
-
134
-
135
-
136
-
137
-
138
-
139
-
140
-
141
-
142
-
143
-
144
-
145
-
146
-
147
-
148
-
149
-
150
-
151
-
152
-
153
-
154
-
155
-
156
-
157
-
158
-
159
-
160
-
161
-
162
-
163
-
164
-
165
-
166
-
167
-
168
-
169
-
170
-
171
-
172
-
173
-
174
-
175
-
176
-
177
-
178
-
179
-
180
-
181
-
182
-
183
-
184
-
185
-
186
-
187
-
188
-
189
-
190
-
191
-
192
-
193
-
194
-
195
-
196
-
197
-
198
-
199
-
200
-
201
-
202
-
203
-
204
-
205
-
206
-
207
-
208
-
209
-
210
-
211
-
212
-
213
-
214
-
215
-
216
-
217
-
218
-
219
-
220
-
221
-
222
-
223
-
224
-
225
-
226
-
227
-
228
-
229
-
230
-
231
-
232
-
233
-
234
-
235
-
236
-
237
-
238
-
239
-
240
-
241
-
242
-
243
-
244
-
245
-
246
-
247
-
248
-
249
-
250
-
251
-
252
-
253
-
254
-
255
-
256
-
257
-
258
-
259
-
260
-
261
-
262
-
263
-
264
-
265
-
266
-
267
-
268
-
269
-
270
-
271
-
272
-
273
-
274
-
275
-
276
-
277
-
278
-
279
-
280
-
281
-
282
-
283
-
284
-
285
-
286
-
287
-
288
-
289
-
290
-
291
-
292
-
293
-
294
-
295
-
296
-
297
-
298
-
299
-
300
-
301
-
302
-
303
-
304
-
305
-
306
-
307
-
308
-
309
-
310
-
311
-
312
-
313
-
314
-
315
-
316
-
317
-
318
-
319
-
320
-
321
-
322
-
323
-
324
-
325
-
326
-
327
-
328
-
329
-
330
-
331
-
332
-
333
-
334
-
335
-
336
-
337
-
338
-
339
-
340
-
341
-
342
-
343
-
344
-
345
-
346
-
347
-
348
-
349
-
350
-
351
-
352
-
353
-
354
-
355
-
356
-
357
-
358
-
359
-
360
-
361
-
362
-
363
-
364
-
365
-
366
-
367
-
368
-
369
-
370
-
371
-
372
-
373
-
374
-
375
-
376
-
377
-
378
-
379
-
380
-
381
-
382
-
383
-
384
-
385
-
386
-
387
-
388
-
389
-
390
-
391
-
392
-
393
-
394
-
395
-
 396
396 -
 397
397 -
 398
398 -
 399
399 -
 400
400 -
 401
401 -
 402
402 -
 403
403 -
 404
404 -
 405
405 -
 406
406 -
 407
407 -
 408
408 -
 409
409 -
 410
410 -
 411
411 -
 412
412 -
 413
413 -
 414
414 -
 415
415 -
 416
416 -
417
-
418
-
419
-
420
-
421
-
422
-
423
-
424
-
425
-
426
-
427
-
428
-
429
-
430
-
431
-
432
-
433
-
434
-
435
-
436
-
437
-
438
-
439
-
440
-
441
-
442
-
443
-
444
-
445
-
446
-
447
-
448
-
449
-
450
-
451
-
452
-
453
-
454
-
455
-
456
-
457
-
458
-
459
-
460
-
461
-
462
-
463
-
464
-
465
-
466
-
467
-
468
-
469
-
470
-
471
-
472
 |
 |

HSBC HOLDINGS PLC
Notes on the Financial Statements (continued)
Notes 19 and 20
404
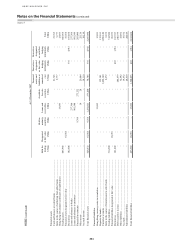
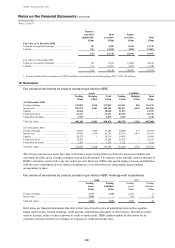
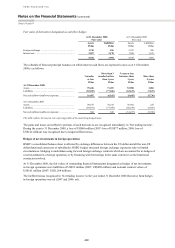
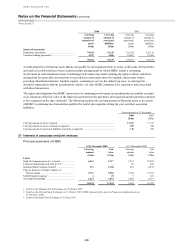
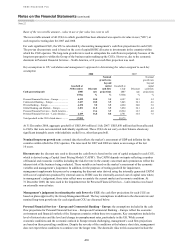
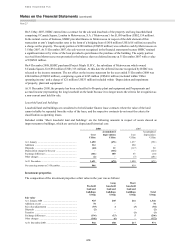
Included within the above figures are debt securities issued by banks and other financial institutions of
US$140,878 million (2007: US$142,863 million; 2006: US$86,649 million), of which US$39,213 million (2007:
US$2,490 million; 2006: nil) are guaranteed by various governments.
The fair value of the debt securities issued by banks and other financial institutions was US$141,526 million (2007:
US$143,023 million; 2006: US$86,596 million).
Treasury
and other
eligible bills
available-
for-sale
Debt
securities
available-
for-sale
Debt
securities
held-to-
maturity
Equity
securities
Total
US$m US$m US$m US$m US$m
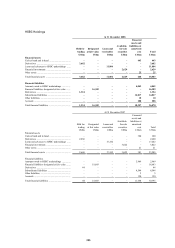
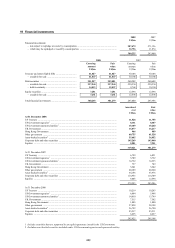
Carrying amount at 31 December 2008
Listed on a recognised exchange .................................... 3,539 108,972 2,332 471 115,314
Unlisted ........................................................................... 37,488 128,972 11,681 6,780 184,921
41,027 237,944 14,013 7,251 300,235
Carrying amount at 31 December 2007
Listed on a recognised exchange .................................... 1,062 107,059 3,399 3,301 114,821
Unlisted ........................................................................... 29,042 123,475 6,369 9,293 168,179
30,104 230,534 9,768
12,594 283,000
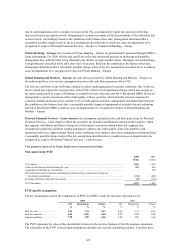
The fair value of listed held-to-maturity debt securities as at 31 December 2008 was US$4,926 million (2007:
US$3,469 million). Included within listed investments were US$1,475 million (2007: US$2,066 million) of
investments listed in Hong Kong.
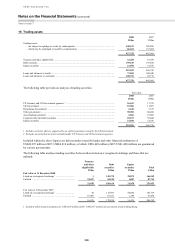
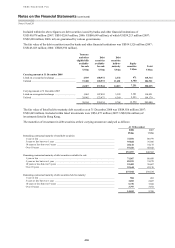
The maturities of investment in debt securities at their carrying amount are analysed as follows:
At 31 December
2008 2007
US$m US$m
Remaining contractual maturity of total debt securities:
1 year or less .................................................................................................................................. 72,551 80,979
5 years or less but over 1 year ....................................................................................................... 93,824 76,306
10 years or less but over 5 years ................................................................................................... 28,141 34,175
Over 10 years ................................................................................................................................. 57,441 48,842
251,957 240,302
Remaining contractual maturity of debt securities available for sale:
1 year or less .................................................................................................................................. 71,967 80,498
5 years or less but over 1 year ....................................................................................................... 89,931 74,279
10 years or less but over 5 years ................................................................................................... 22,402 30,607
Over 10 years ................................................................................................................................. 53,644 45,150
237,944 230,534
Remaining contractual maturity of debt securities held to maturity:
1 year or less .................................................................................................................................. 584 481
5 years or less but over 1 year ....................................................................................................... 3,893 2,027
10 years or less but over 5 years ................................................................................................... 5,739 3,568
Over 10 years ................................................................................................................................. 3,797 3,692
14,013 9,768