HSBC 2008 Annual Report Download - page 260
Download and view the complete annual report
Please find page 260 of the 2008 HSBC annual report below. You can navigate through the pages in the report by either clicking on the pages listed below, or by using the keyword search tool below to find specific information within the annual report.-
 1
1 -
2
-
3
-
4
-
5
-
6
-
7
-
8
-
9
-
10
-
11
-
12
-
13
-
14
-
15
-
16
-
17
-
18
-
19
-
20
-
21
-
22
-
23
-
24
-
25
-
26
-
27
-
28
-
29
-
30
-
31
-
32
-
33
-
34
-
35
-
36
-
37
-
38
-
39
-
40
-
41
-
42
-
43
-
44
-
45
-
46
-
47
-
48
-
49
-
50
-
51
-
52
-
53
-
54
-
55
-
56
-
57
-
58
-
59
-
60
-
61
-
62
-
63
-
64
-
65
-
66
-
67
-
68
-
69
-
70
-
71
-
72
-
73
-
74
-
75
-
76
-
77
-
78
-
79
-
80
-
81
-
82
-
83
-
84
-
85
-
86
-
87
-
88
-
89
-
90
-
91
-
92
-
93
-
94
-
95
-
96
-
97
-
98
-
99
-
100
-
101
-
102
-
103
-
104
-
105
-
106
-
107
-
108
-
109
-
110
-
111
-
112
-
113
-
114
-
115
-
116
-
117
-
118
-
119
-
120
-
121
-
122
-
123
-
124
-
125
-
126
-
127
-
128
-
129
-
130
-
131
-
132
-
133
-
134
-
135
-
136
-
137
-
138
-
139
-
140
-
141
-
142
-
143
-
144
-
145
-
146
-
147
-
148
-
149
-
150
-
151
-
152
-
153
-
154
-
155
-
156
-
157
-
158
-
159
-
160
-
161
-
162
-
163
-
164
-
165
-
166
-
167
-
168
-
169
-
170
-
171
-
172
-
173
-
174
-
175
-
176
-
177
-
178
-
179
-
180
-
181
-
182
-
183
-
184
-
185
-
186
-
187
-
188
-
189
-
190
-
191
-
192
-
193
-
194
-
195
-
196
-
197
-
198
-
199
-
200
-
201
-
202
-
203
-
204
-
205
-
206
-
207
-
208
-
209
-
210
-
211
-
212
-
213
-
214
-
215
-
216
-
217
-
218
-
219
-
220
-
221
-
222
-
223
-
224
-
225
-
226
-
227
-
228
-
229
-
230
-
231
-
232
-
233
-
234
-
235
-
236
-
237
-
238
-
239
-
240
-
241
-
242
-
243
-
244
-
245
-
246
-
247
-
248
-
249
-
 250
250 -
 251
251 -
 252
252 -
 253
253 -
 254
254 -
 255
255 -
 256
256 -
 257
257 -
 258
258 -
 259
259 -
 260
260 -
 261
261 -
 262
262 -
 263
263 -
 264
264 -
 265
265 -
 266
266 -
 267
267 -
 268
268 -
 269
269 -
 270
270 -
271
-
272
-
273
-
274
-
275
-
276
-
277
-
278
-
279
-
280
-
281
-
282
-
283
-
284
-
285
-
286
-
287
-
288
-
289
-
290
-
291
-
292
-
293
-
294
-
295
-
296
-
297
-
298
-
299
-
300
-
301
-
302
-
303
-
304
-
305
-
306
-
307
-
308
-
309
-
310
-
311
-
312
-
313
-
314
-
315
-
316
-
317
-
318
-
319
-
320
-
321
-
322
-
323
-
324
-
325
-
326
-
327
-
328
-
329
-
330
-
331
-
332
-
333
-
334
-
335
-
336
-
337
-
338
-
339
-
340
-
341
-
342
-
343
-
344
-
345
-
346
-
347
-
348
-
349
-
350
-
351
-
352
-
353
-
354
-
355
-
356
-
357
-
358
-
359
-
360
-
361
-
362
-
363
-
364
-
365
-
366
-
367
-
368
-
369
-
370
-
371
-
372
-
373
-
374
-
375
-
376
-
377
-
378
-
379
-
380
-
381
-
382
-
383
-
384
-
385
-
386
-
387
-
388
-
389
-
390
-
391
-
392
-
393
-
394
-
395
-
396
-
397
-
398
-
399
-
400
-
401
-
402
-
403
-
404
-
405
-
406
-
407
-
408
-
409
-
410
-
411
-
412
-
413
-
414
-
415
-
416
-
417
-
418
-
419
-
420
-
421
-
422
-
423
-
424
-
425
-
426
-
427
-
428
-
429
-
430
-
431
-
432
-
433
-
434
-
435
-
436
-
437
-
438
-
439
-
440
-
441
-
442
-
443
-
444
-
445
-
446
-
447
-
448
-
449
-
450
-
451
-
452
-
453
-
454
-
455
-
456
-
457
-
458
-
459
-
460
-
461
-
462
-
463
-
464
-
465
-
466
-
467
-
468
-
469
-
470
-
471
-
472
 |
 |

HSBC HOLDINGS PLC
Report of the Directors: Risk (continued)
Insurance operations > Insurance risk
258
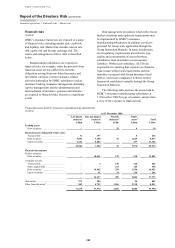
The main contracts which generate exposure to
mortality and morbidity risks are term assurance
contracts and annuities. These risks are monitored on
a regular basis, and are primarily mitigated by
medical underwriting and by retaining the ability in
certain cases to amend premiums in the light of
experience. The risk associated with lapses and
surrenders is generally mitigated by the application
of surrender charges, though other management
actions, such as managing the level of bonus
payments to policyholders, may be taken. Expense
risk is generally managed through pricing. The level
of expenses in the contract will be one of the factors
considered when setting premiums rates.
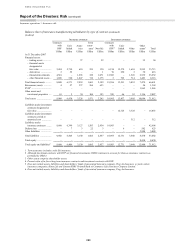
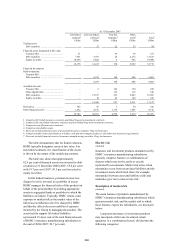
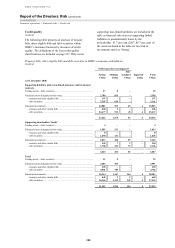
Analysis of non-life insurance risk – net written insurance premiums1
(Audited)
Europe
Hong
Kong
Rest of
Asia-
Pacific
North
America
Latin
America
Total
US$m US$m US$m US$m US$m US$m
2008
Accident and health ............................................ 14 155 5 3 27 204
Motor .................................................................. 350 15 14 – 273 652
Fire and other damage ........................................ 150 26 3 4 22 205
Liability ............................................................... – 14 4 – 34 52
Credit (non-life) .................................................. 99 – – 144 – 243
Marine, aviation and transport ............................ – 11 4 – 24 39
Other non-life insurance contracts ..................... 49 28 – 15 29 121
Total net written insurance premiums ................ 662 249 30 166 409 1,516
Net insurance claims incurred and movement
in liabilities to policyholders........................... (553) (121) (13) (98) (176) (961)
2007
Accident and health ............................................ 27 132 5 – 25 189
Motor .................................................................. 369 15 10 – 224 618
Fire and other damage ........................................ 178 23 7 2 19 229
Liability ............................................................... – 12 3 8 34 57
Credit (non-life) .................................................. 76 – – 157 – 233
Marine, aviation and transport ............................ – 12 4 – 18 34
Other non-life insurance contracts ..................... 30 24 – 30 24 108
Total net written insurance premiums ................ 680 218 29 197 344 1,468
Net insurance claims incurred and movement
in liabilities to policyholders........................... (598) (90) (10) (79) (151) (928)
2006
Accident and health ............................................ 26 97 5 – 10 138
Motor .................................................................. 185 15 13 – 157 370
Fire and other damage ........................................ 221 22 5 2 9 259
Liability ............................................................... 1 13 2 8 24 48
Credit (non-life) .................................................. 264 – – 173 – 437
Marine, aviation and transport ............................ 1 11 3 – 12 27
Other non-life insurance contracts ..................... 13 24 – 37 20 94
Total net written insurance premiums ................ 711 182 28 220 232 1,373
Net insurance claims incurred and movement
in liabilities to policyholders........................... (451) (76) (11) (79) (111) (728)
1 Net written insurance premiums represent gross written premiums less gross written premiums ceded to reinsurers.
(Audited)
The above table of non-life net written insurance
premiums provides an overall summary of the
non-life insurance activity of the Group. Motor
business is written predominantly in Europe and
Latin America and represented the largest class of
non-life business in 2008. Fire and other damage to
property business is written in all major markets,
most significantly in Europe. Credit non-life
insurance, which is originated in conjunction with
the provision of loans, is concentrated in the US
and Europe.
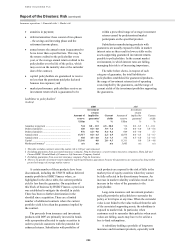
The main risks associated with non-life business
are underwriting risk and claims experience risk.
Underwriting risk is the risk that HSBC does not
charge premiums appropriate to the cover provided
and claims experience risk is the risk that portfolio
experience is worse than expected. HSBC manages
these risks through pricing (for example, imposing