HSBC 2008 Annual Report Download - page 432
Download and view the complete annual report
Please find page 432 of the 2008 HSBC annual report below. You can navigate through the pages in the report by either clicking on the pages listed below, or by using the keyword search tool below to find specific information within the annual report.-
 1
1 -
2
-
3
-
4
-
5
-
6
-
7
-
8
-
9
-
10
-
11
-
12
-
13
-
14
-
15
-
16
-
17
-
18
-
19
-
20
-
21
-
22
-
23
-
24
-
25
-
26
-
27
-
28
-
29
-
30
-
31
-
32
-
33
-
34
-
35
-
36
-
37
-
38
-
39
-
40
-
41
-
42
-
43
-
44
-
45
-
46
-
47
-
48
-
49
-
50
-
51
-
52
-
53
-
54
-
55
-
56
-
57
-
58
-
59
-
60
-
61
-
62
-
63
-
64
-
65
-
66
-
67
-
68
-
69
-
70
-
71
-
72
-
73
-
74
-
75
-
76
-
77
-
78
-
79
-
80
-
81
-
82
-
83
-
84
-
85
-
86
-
87
-
88
-
89
-
90
-
91
-
92
-
93
-
94
-
95
-
96
-
97
-
98
-
99
-
100
-
101
-
102
-
103
-
104
-
105
-
106
-
107
-
108
-
109
-
110
-
111
-
112
-
113
-
114
-
115
-
116
-
117
-
118
-
119
-
120
-
121
-
122
-
123
-
124
-
125
-
126
-
127
-
128
-
129
-
130
-
131
-
132
-
133
-
134
-
135
-
136
-
137
-
138
-
139
-
140
-
141
-
142
-
143
-
144
-
145
-
146
-
147
-
148
-
149
-
150
-
151
-
152
-
153
-
154
-
155
-
156
-
157
-
158
-
159
-
160
-
161
-
162
-
163
-
164
-
165
-
166
-
167
-
168
-
169
-
170
-
171
-
172
-
173
-
174
-
175
-
176
-
177
-
178
-
179
-
180
-
181
-
182
-
183
-
184
-
185
-
186
-
187
-
188
-
189
-
190
-
191
-
192
-
193
-
194
-
195
-
196
-
197
-
198
-
199
-
200
-
201
-
202
-
203
-
204
-
205
-
206
-
207
-
208
-
209
-
210
-
211
-
212
-
213
-
214
-
215
-
216
-
217
-
218
-
219
-
220
-
221
-
222
-
223
-
224
-
225
-
226
-
227
-
228
-
229
-
230
-
231
-
232
-
233
-
234
-
235
-
236
-
237
-
238
-
239
-
240
-
241
-
242
-
243
-
244
-
245
-
246
-
247
-
248
-
249
-
250
-
251
-
252
-
253
-
254
-
255
-
256
-
257
-
258
-
259
-
260
-
261
-
262
-
263
-
264
-
265
-
266
-
267
-
268
-
269
-
270
-
271
-
272
-
273
-
274
-
275
-
276
-
277
-
278
-
279
-
280
-
281
-
282
-
283
-
284
-
285
-
286
-
287
-
288
-
289
-
290
-
291
-
292
-
293
-
294
-
295
-
296
-
297
-
298
-
299
-
300
-
301
-
302
-
303
-
304
-
305
-
306
-
307
-
308
-
309
-
310
-
311
-
312
-
313
-
314
-
315
-
316
-
317
-
318
-
319
-
320
-
321
-
322
-
323
-
324
-
325
-
326
-
327
-
328
-
329
-
330
-
331
-
332
-
333
-
334
-
335
-
336
-
337
-
338
-
339
-
340
-
341
-
342
-
343
-
344
-
345
-
346
-
347
-
348
-
349
-
350
-
351
-
352
-
353
-
354
-
355
-
356
-
357
-
358
-
359
-
360
-
361
-
362
-
363
-
364
-
365
-
366
-
367
-
368
-
369
-
370
-
371
-
372
-
373
-
374
-
375
-
376
-
377
-
378
-
379
-
380
-
381
-
382
-
383
-
384
-
385
-
386
-
387
-
388
-
389
-
390
-
391
-
392
-
393
-
394
-
395
-
396
-
397
-
398
-
399
-
400
-
401
-
402
-
403
-
404
-
405
-
406
-
407
-
408
-
409
-
410
-
411
-
412
-
413
-
414
-
415
-
416
-
417
-
418
-
419
-
420
-
421
-
 422
422 -
 423
423 -
 424
424 -
 425
425 -
 426
426 -
 427
427 -
 428
428 -
 429
429 -
 430
430 -
 431
431 -
 432
432 -
 433
433 -
 434
434 -
 435
435 -
 436
436 -
 437
437 -
 438
438 -
 439
439 -
 440
440 -
 441
441 -
 442
442 -
443
-
444
-
445
-
446
-
447
-
448
-
449
-
450
-
451
-
452
-
453
-
454
-
455
-
456
-
457
-
458
-
459
-
460
-
461
-
462
-
463
-
464
-
465
-
466
-
467
-
468
-
469
-
470
-
471
-
472
 |
 |

HSBC HOLDINGS PLC
Notes on the Financial Statements (continued)
Notes 34, 35, 36 and 37
430
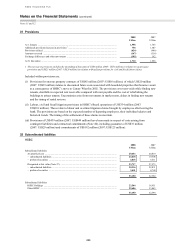
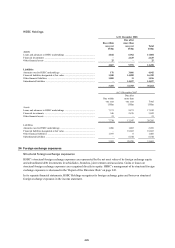
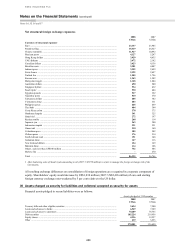
Net structural foreign exchange exposures
2008 2007
US$m US$m
Currency of structural exposure
Euro .................................................................................................................................................... 23,137 23,985
Pound sterling .................................................................................................................................... 15,319 24,527
Chinese renminbi ............................................................................................................................... 11,927 10,892
Mexican pesos ................................................................................................................................... 4,127 5,247
Hong Kong dollars ............................................................................................................................. 3,929 4,635
UAE dirhams ..................................................................................................................................... 3,472 2,182
Canadian dollars ................................................................................................................................ 3,423 4,136
Brazilian reais .................................................................................................................................... 3,381 4,007
Indian rupees ...................................................................................................................................... 3,252 2,699
Swiss francs ....................................................................................................................................... 2,192 2,657
Turkish lira ......................................................................................................................................... 1,505 1,796
Korean won ........................................................................................................................................ 1,243 1,282
Malaysian ringgit ............................................................................................................................... 1,148 1,044
Australian dollars ............................................................................................................................... 690 940
Singapore dollars ............................................................................................................................... 534 432
Saudi riyals1 ....................................................................................................................................... 530 404
Egyptian pounds ................................................................................................................................ 517 392
Argentine pesos ................................................................................................................................. 510 370
Taiwanese dollars .............................................................................................................................. 485 382
Vietnamese dong ............................................................................................................................... 483 331
Philippine pesos ................................................................................................................................. 445 459
Thai baht ............................................................................................................................................ 404 384
Costa Rican colon .............................................................................................................................. 378 375
Honduran lempira .............................................................................................................................. 341 325
Qatari rial ........................................................................................................................................... 272 197
Russian rouble ................................................................................................................................... 268 114
Japanese yen ...................................................................................................................................... 263 300
Indonesian rupiah .............................................................................................................................. 221 221
Omani rial .......................................................................................................................................... 210 140
Colombian peso ................................................................................................................................. 185 202
Chilean pesos ..................................................................................................................................... 176 214
South African rand ............................................................................................................................. 151 148
Jordanian dinar ................................................................................................................................... 147 116
New Zealand dollars .......................................................................................................................... 124 169
Bahraini dinar .................................................................................................................................... 114 106
Others, each less than US$100 million .............................................................................................. 732 686
Maltese lira ........................................................................................................................................ – 270
Total ................................................................................................................................................... 86,235 96,766
1 After deducting sales of Saudi riyals amounting to nil (2007: US$750 million) in order to manage the foreign exchange risk of the
investments.
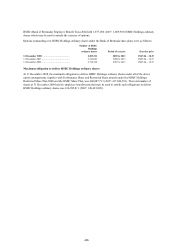
All resulting exchange differences on consolidation of foreign operations are recognised in a separate component of
equity. Shareholders’ equity would decrease by US$1,830 million (2007: US$2,426 million) if euro and sterling
foreign currency exchange rates weakened by 5 per cent relative to the US dollar.
35 Assets charged as security for liabilities and collateral accepted as security for assets
Financial assets pledged to secure liabilities were as follows:
Assets pledged at 31 December
2008 2007
US$m US$m
Treasury bills and other eligible securities ........................................................................................ 3,434 7,200
Loans and advances to banks ............................................................................................................ 6,949 7,389
Loans and advances to customers ...................................................................................................... 70,209 78,755
Debt securities ................................................................................................................................... 185,224 219,956
Equity shares ...................................................................................................................................... 4,326 19,257
Other .................................................................................................................................................. 439 3,933
270,581 336,490