HSBC 2008 Annual Report Download - page 74
Download and view the complete annual report
Please find page 74 of the 2008 HSBC annual report below. You can navigate through the pages in the report by either clicking on the pages listed below, or by using the keyword search tool below to find specific information within the annual report.-
 1
1 -
2
-
3
-
4
-
5
-
6
-
7
-
8
-
9
-
10
-
11
-
12
-
13
-
14
-
15
-
16
-
17
-
18
-
19
-
20
-
21
-
22
-
23
-
24
-
25
-
26
-
27
-
28
-
29
-
30
-
31
-
32
-
33
-
34
-
35
-
36
-
37
-
38
-
39
-
40
-
41
-
42
-
43
-
44
-
45
-
46
-
47
-
48
-
49
-
50
-
51
-
52
-
53
-
54
-
55
-
56
-
57
-
58
-
59
-
60
-
61
-
62
-
63
-
 64
64 -
 65
65 -
 66
66 -
 67
67 -
 68
68 -
 69
69 -
 70
70 -
 71
71 -
 72
72 -
 73
73 -
 74
74 -
 75
75 -
 76
76 -
 77
77 -
 78
78 -
 79
79 -
 80
80 -
 81
81 -
 82
82 -
 83
83 -
 84
84 -
85
-
86
-
87
-
88
-
89
-
90
-
91
-
92
-
93
-
94
-
95
-
96
-
97
-
98
-
99
-
100
-
101
-
102
-
103
-
104
-
105
-
106
-
107
-
108
-
109
-
110
-
111
-
112
-
113
-
114
-
115
-
116
-
117
-
118
-
119
-
120
-
121
-
122
-
123
-
124
-
125
-
126
-
127
-
128
-
129
-
130
-
131
-
132
-
133
-
134
-
135
-
136
-
137
-
138
-
139
-
140
-
141
-
142
-
143
-
144
-
145
-
146
-
147
-
148
-
149
-
150
-
151
-
152
-
153
-
154
-
155
-
156
-
157
-
158
-
159
-
160
-
161
-
162
-
163
-
164
-
165
-
166
-
167
-
168
-
169
-
170
-
171
-
172
-
173
-
174
-
175
-
176
-
177
-
178
-
179
-
180
-
181
-
182
-
183
-
184
-
185
-
186
-
187
-
188
-
189
-
190
-
191
-
192
-
193
-
194
-
195
-
196
-
197
-
198
-
199
-
200
-
201
-
202
-
203
-
204
-
205
-
206
-
207
-
208
-
209
-
210
-
211
-
212
-
213
-
214
-
215
-
216
-
217
-
218
-
219
-
220
-
221
-
222
-
223
-
224
-
225
-
226
-
227
-
228
-
229
-
230
-
231
-
232
-
233
-
234
-
235
-
236
-
237
-
238
-
239
-
240
-
241
-
242
-
243
-
244
-
245
-
246
-
247
-
248
-
249
-
250
-
251
-
252
-
253
-
254
-
255
-
256
-
257
-
258
-
259
-
260
-
261
-
262
-
263
-
264
-
265
-
266
-
267
-
268
-
269
-
270
-
271
-
272
-
273
-
274
-
275
-
276
-
277
-
278
-
279
-
280
-
281
-
282
-
283
-
284
-
285
-
286
-
287
-
288
-
289
-
290
-
291
-
292
-
293
-
294
-
295
-
296
-
297
-
298
-
299
-
300
-
301
-
302
-
303
-
304
-
305
-
306
-
307
-
308
-
309
-
310
-
311
-
312
-
313
-
314
-
315
-
316
-
317
-
318
-
319
-
320
-
321
-
322
-
323
-
324
-
325
-
326
-
327
-
328
-
329
-
330
-
331
-
332
-
333
-
334
-
335
-
336
-
337
-
338
-
339
-
340
-
341
-
342
-
343
-
344
-
345
-
346
-
347
-
348
-
349
-
350
-
351
-
352
-
353
-
354
-
355
-
356
-
357
-
358
-
359
-
360
-
361
-
362
-
363
-
364
-
365
-
366
-
367
-
368
-
369
-
370
-
371
-
372
-
373
-
374
-
375
-
376
-
377
-
378
-
379
-
380
-
381
-
382
-
383
-
384
-
385
-
386
-
387
-
388
-
389
-
390
-
391
-
392
-
393
-
394
-
395
-
396
-
397
-
398
-
399
-
400
-
401
-
402
-
403
-
404
-
405
-
406
-
407
-
408
-
409
-
410
-
411
-
412
-
413
-
414
-
415
-
416
-
417
-
418
-
419
-
420
-
421
-
422
-
423
-
424
-
425
-
426
-
427
-
428
-
429
-
430
-
431
-
432
-
433
-
434
-
435
-
436
-
437
-
438
-
439
-
440
-
441
-
442
-
443
-
444
-
445
-
446
-
447
-
448
-
449
-
450
-
451
-
452
-
453
-
454
-
455
-
456
-
457
-
458
-
459
-
460
-
461
-
462
-
463
-
464
-
465
-
466
-
467
-
468
-
469
-
470
-
471
-
472
 |
 |

HSBC HOLDINGS PLC
Report of the Directors: Operating and Financial Review (continued)
Customer groups > Commercial Banking
72
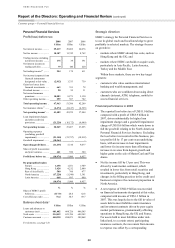
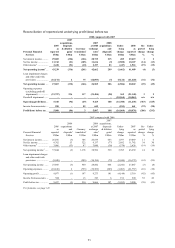
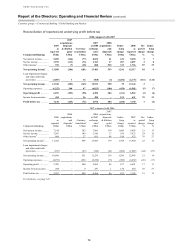
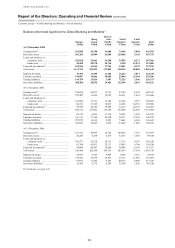
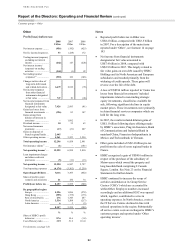
Commercial Banking
Profit before tax
2008 2007 2006
US$m US$m US$m
Net interest income ........... 9,494 9,055 7,514
Net fee income .................. 4,097 3,972 3,207
Trading income excluding
net interest income ......... 369 265 204
Net interest income on
trading activities ............. 17 31 20
Net trading income16 ......... 386 296 224
Net income/(expense) from
financial instruments
designated at fair value .. (224) 22 (22)
Gains less losses from
financial investments ..... 193 90 44
Dividend income ............... 88 8 6
Net earned insurance
premiums ....................... 679 733 258
Other operating income .... 939 165 250
Total operating income .. 15,652 14,341 11,481
Net insurance claims17 ...... (335) (391) (96)
Net operating income5 ..... 15,317 13,950 11,385
Loan impairment charges
and other credit risk
provisions ....................... (2,173) (1,007) (697)
Net operating income ..... 13,144 12,943 10,688
Total operating expenses .. (6,581) (6,252) (4,979)
Operating profit .............. 6,563 6,691 5,709
Share of profit in associates
and joint ventures ........... 631 454 288
Profit before tax .............. 7,194 7,145 5,997
By geographical region
Europe ............................ 2,722 2,516 2,234
Hong Kong ..................... 1,315 1,619 1,321
Rest of Asia-Pacific ....... 1,793 1,350 1,034
North America ............... 658 920 957
Latin America ................ 706 740 451
7,194 7,145 5,997
% % %
Share of HSBC’s profit
before tax ....................... 77.3
29.5 27.2
Cost efficiency ratio .......... 43.0 44.8 43.7
Balance sheet data15
US$m US$m US$m
Loans and advances to
customers (net) ............... 203,949 220,068 172,976
Total assets ........................ 249,218 307,944 228,668
Customer accounts ............ 235,879 237,987 190,853
For footnotes, see page 143.
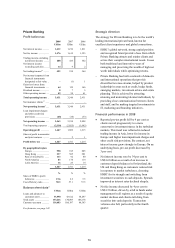
Strategic direction
HSBC’s Commercial Banking strategy is focused on
two key initiatives:
− to be the leading international business bank,
using HSBC’s extensive geographical network
together with product expertise in payments,
trade, receivables finance and foreign exchange
to actively support customers trading and
investing across borders; and
− to be the best bank for small businesses in target
markets, building global scale and creating
efficiencies by sharing best practice, including
customer experience and credit scoring, and
selectively rolling out the direct banking model.
Financial performance in 2008
• Reported pre-tax profit was broadly in line with
2007 at US$7.2 billion as revenue growth was
offset by the rise in loan impairment charges and
operating costs. Pre-tax profit growth was
evident in emerging markets, with their
contribution increasing to 56 per cent excluding
a gain of US$425 million on the disposal of the
UK merchant acquiring division, recorded in
‘Other operating income’. Profit growth was
most significant in Australia, India, mainland
China, United Arab Emirates (‘UAE’), Turkey,
Brazil and Argentina.
• HSBC remained committed to new lending,
increasing lending balances by 10 per cent.
Deposit growth of 15 per cent was driven by
brand strength, particularly in the UK, the US
and Hong Kong.
• Balance sheet growth drove a 7 per cent rise in
net interest income, notwithstanding the adverse
affect of widespread reductions in interest rates
on liability spreads. This was partly offset by
higher lending spreads from improved pricing.
• Net fee income rose by 8 per cent with income
from trade services and foreign exchange
growing particularly strongly.
• Other income was boosted by a number of
significant gains, notably from the sale of shares
in MasterCard and Visa.
• Loan impairment charges increased from
US$1.0 billion in 2007 to US$2.2 billion, as the
previously benign credit environment was
replaced by economic slowdown in most
countries. Loan impairment charges increased
by 44 basis points to 1 per cent of average
reported assets, with most of the increase
coming in the second half of 2008.