HSBC 2008 Annual Report Download - page 103
Download and view the complete annual report
Please find page 103 of the 2008 HSBC annual report below. You can navigate through the pages in the report by either clicking on the pages listed below, or by using the keyword search tool below to find specific information within the annual report.-
 1
1 -
2
-
3
-
4
-
5
-
6
-
7
-
8
-
9
-
10
-
11
-
12
-
13
-
14
-
15
-
16
-
17
-
18
-
19
-
20
-
21
-
22
-
23
-
24
-
25
-
26
-
27
-
28
-
29
-
30
-
31
-
32
-
33
-
34
-
35
-
36
-
37
-
38
-
39
-
40
-
41
-
42
-
43
-
44
-
45
-
46
-
47
-
48
-
49
-
50
-
51
-
52
-
53
-
54
-
55
-
56
-
57
-
58
-
59
-
60
-
61
-
62
-
63
-
64
-
65
-
66
-
67
-
68
-
69
-
70
-
71
-
72
-
73
-
74
-
75
-
76
-
77
-
78
-
79
-
80
-
81
-
82
-
83
-
84
-
85
-
86
-
87
-
88
-
89
-
90
-
91
-
92
-
 93
93 -
 94
94 -
 95
95 -
 96
96 -
 97
97 -
 98
98 -
 99
99 -
 100
100 -
 101
101 -
 102
102 -
 103
103 -
 104
104 -
 105
105 -
 106
106 -
 107
107 -
 108
108 -
 109
109 -
 110
110 -
 111
111 -
 112
112 -
 113
113 -
114
-
115
-
116
-
117
-
118
-
119
-
120
-
121
-
122
-
123
-
124
-
125
-
126
-
127
-
128
-
129
-
130
-
131
-
132
-
133
-
134
-
135
-
136
-
137
-
138
-
139
-
140
-
141
-
142
-
143
-
144
-
145
-
146
-
147
-
148
-
149
-
150
-
151
-
152
-
153
-
154
-
155
-
156
-
157
-
158
-
159
-
160
-
161
-
162
-
163
-
164
-
165
-
166
-
167
-
168
-
169
-
170
-
171
-
172
-
173
-
174
-
175
-
176
-
177
-
178
-
179
-
180
-
181
-
182
-
183
-
184
-
185
-
186
-
187
-
188
-
189
-
190
-
191
-
192
-
193
-
194
-
195
-
196
-
197
-
198
-
199
-
200
-
201
-
202
-
203
-
204
-
205
-
206
-
207
-
208
-
209
-
210
-
211
-
212
-
213
-
214
-
215
-
216
-
217
-
218
-
219
-
220
-
221
-
222
-
223
-
224
-
225
-
226
-
227
-
228
-
229
-
230
-
231
-
232
-
233
-
234
-
235
-
236
-
237
-
238
-
239
-
240
-
241
-
242
-
243
-
244
-
245
-
246
-
247
-
248
-
249
-
250
-
251
-
252
-
253
-
254
-
255
-
256
-
257
-
258
-
259
-
260
-
261
-
262
-
263
-
264
-
265
-
266
-
267
-
268
-
269
-
270
-
271
-
272
-
273
-
274
-
275
-
276
-
277
-
278
-
279
-
280
-
281
-
282
-
283
-
284
-
285
-
286
-
287
-
288
-
289
-
290
-
291
-
292
-
293
-
294
-
295
-
296
-
297
-
298
-
299
-
300
-
301
-
302
-
303
-
304
-
305
-
306
-
307
-
308
-
309
-
310
-
311
-
312
-
313
-
314
-
315
-
316
-
317
-
318
-
319
-
320
-
321
-
322
-
323
-
324
-
325
-
326
-
327
-
328
-
329
-
330
-
331
-
332
-
333
-
334
-
335
-
336
-
337
-
338
-
339
-
340
-
341
-
342
-
343
-
344
-
345
-
346
-
347
-
348
-
349
-
350
-
351
-
352
-
353
-
354
-
355
-
356
-
357
-
358
-
359
-
360
-
361
-
362
-
363
-
364
-
365
-
366
-
367
-
368
-
369
-
370
-
371
-
372
-
373
-
374
-
375
-
376
-
377
-
378
-
379
-
380
-
381
-
382
-
383
-
384
-
385
-
386
-
387
-
388
-
389
-
390
-
391
-
392
-
393
-
394
-
395
-
396
-
397
-
398
-
399
-
400
-
401
-
402
-
403
-
404
-
405
-
406
-
407
-
408
-
409
-
410
-
411
-
412
-
413
-
414
-
415
-
416
-
417
-
418
-
419
-
420
-
421
-
422
-
423
-
424
-
425
-
426
-
427
-
428
-
429
-
430
-
431
-
432
-
433
-
434
-
435
-
436
-
437
-
438
-
439
-
440
-
441
-
442
-
443
-
444
-
445
-
446
-
447
-
448
-
449
-
450
-
451
-
452
-
453
-
454
-
455
-
456
-
457
-
458
-
459
-
460
-
461
-
462
-
463
-
464
-
465
-
466
-
467
-
468
-
469
-
470
-
471
-
472
 |
 |
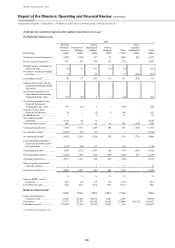
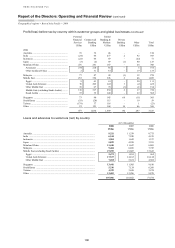
101
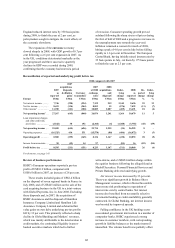
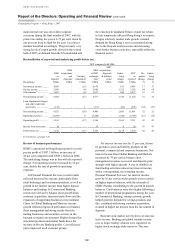
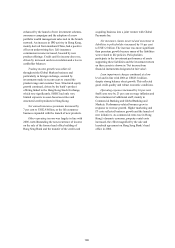
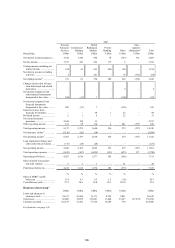
of trade finance grew strongly, driven by demand
from corporates with international trade
requirements, and commercial lending balances rose,
particularly during the first half of the year.
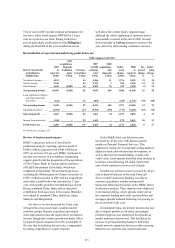
Fee income declined by 23 per cent, driven by
lower equity market-related revenues. Weak market
sentiment led to lower volumes of retail brokerage
and a decrease in income from wealth management
activity. This was partly offset by a rise in fees from
cards following increases in both cards in circulation
and cardholder spending. Fees from account services
rose due to greater customer activity and there were
higher fees generated from bundled products.
Trading income was 4 per cent lower, driven by
further write-downs of US$0.2 billion in Global
Banking and Markets on a legacy monoline
exposure. Excluding these write-downs, trading
income grew due to a rise in foreign exchange and
rates income as continuing market volatility
generated increased trading opportunities and
demand for active hedging products.
The net loss of US$1.2 billion on financial
instruments designated at fair value compared with
income of US$676 million in 2007. The loss
reflected a decline in the value of assets linked to the
insurance business. To a large extent, these losses
are attributable to policyholders, with an equivalent
reduction in net insurance claims and movement in
liabilities to policyholders. While the decline in the
value of assets which relate to unit-linked products is
allocated to policyholders in full, the portion of
decline in the value passed on to clients who have
products with discretionary participation features
and guarantees may be restricted.
Losses from financial investments of
US$309 million reflected impairments required on
investments which have experienced significant falls
in equity market prices. These equity investments
are classified as available for sale, are not held for
trading, and remain part of the strategic positioning
of HSBC’s businesses in Asia. These losses
were partly offset by an aggregate gain of
US$203 million from the redemption of shares
in the Visa initial public offering (‘IPO’) and the
disposal of MasterCard shares.
Net earned insurance premiums increased by
16 per cent to US$3.2 billion, largely due to growth
in the life insurance business, in particular for
policies with discretionary participation features.
Net insurance claims and movement in
liabilities to policyholders fell by 40 per cent,
reflecting the decline in asset values noted above
partly offset by increases due to growth in
premiums.
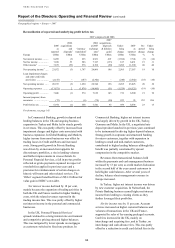
Loan impairment charges and other credit risk
provisions rose markedly from the previously low
level to US$765 million as economic conditions
deteriorated. Within these charges were exposures to
financial institutions held within Global Banking and
Markets, which resulted in other credit risk
provisions. In Commercial Banking, the combination
of an absence of significant recoveries recorded in
2007 and weakness among certain exporters in Hong
Kong, who were affected by reduced demand from
the US and other developed countries, raised loan
impairment charges. As local businesses responded
to the economic environment, unemployment rose in
the second half of 2008. Credit policies were
consequently adjusted across certain products as
delinquency and bankruptcy increased in
Hong Kong. Although property market declines
reduced equity levels for residential mortgage
customers, the impact on loan impairment charges
was limited as this lending was well-secured and
regulatory restrictions constrained origination loan-
to-value ratios to below 70 per cent.
Operating expenses rose by 4 per cent. Staff
costs declined by 3 per cent despite wage increases
and a rise in the number of customer-facing staff,
largely due to lower performance-related costs in
Global Banking and Markets. Staff numbers were
higher than in 2007 notwithstanding reductions
within the branch network for lower business
volumes in the latter part of 2008. IT costs rose as
investment in systems continued. Marketing costs
were lower following active management of costs
while property rental costs increased due to higher
market rental rates. Overall, cost growth was
curtailed in response to the more difficult economic
climate.
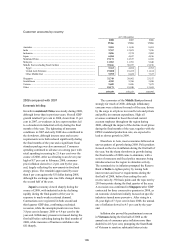
2007 compared with 2006
Economic briefing
Hong Kong’s economy remained robust during
2007, with the annual rate of growth of 6.3 per cent.
Domestic consumption was the major contributor to
economic expansion, supported by the strong labour
market. The unemployment rate fell to 3.4 per cent, a
nine year low, as the supply of labour remained very
tight. Global increases in food and oil prices affected
Hong Kong, but the territory also experienced wage
inflation, rising import prices and growth in property
rental costs. Inflation increased as a result, exceeding
3 per cent in the final quarter of the year.
In response to interest rate cuts in the US and
capital inflows into the local market, Hong Kong’s