HSBC 2008 Annual Report Download - page 335
Download and view the complete annual report
Please find page 335 of the 2008 HSBC annual report below. You can navigate through the pages in the report by either clicking on the pages listed below, or by using the keyword search tool below to find specific information within the annual report.-
 1
1 -
2
-
3
-
4
-
5
-
6
-
7
-
8
-
9
-
10
-
11
-
12
-
13
-
14
-
15
-
16
-
17
-
18
-
19
-
20
-
21
-
22
-
23
-
24
-
25
-
26
-
27
-
28
-
29
-
30
-
31
-
32
-
33
-
34
-
35
-
36
-
37
-
38
-
39
-
40
-
41
-
42
-
43
-
44
-
45
-
46
-
47
-
48
-
49
-
50
-
51
-
52
-
53
-
54
-
55
-
56
-
57
-
58
-
59
-
60
-
61
-
62
-
63
-
64
-
65
-
66
-
67
-
68
-
69
-
70
-
71
-
72
-
73
-
74
-
75
-
76
-
77
-
78
-
79
-
80
-
81
-
82
-
83
-
84
-
85
-
86
-
87
-
88
-
89
-
90
-
91
-
92
-
93
-
94
-
95
-
96
-
97
-
98
-
99
-
100
-
101
-
102
-
103
-
104
-
105
-
106
-
107
-
108
-
109
-
110
-
111
-
112
-
113
-
114
-
115
-
116
-
117
-
118
-
119
-
120
-
121
-
122
-
123
-
124
-
125
-
126
-
127
-
128
-
129
-
130
-
131
-
132
-
133
-
134
-
135
-
136
-
137
-
138
-
139
-
140
-
141
-
142
-
143
-
144
-
145
-
146
-
147
-
148
-
149
-
150
-
151
-
152
-
153
-
154
-
155
-
156
-
157
-
158
-
159
-
160
-
161
-
162
-
163
-
164
-
165
-
166
-
167
-
168
-
169
-
170
-
171
-
172
-
173
-
174
-
175
-
176
-
177
-
178
-
179
-
180
-
181
-
182
-
183
-
184
-
185
-
186
-
187
-
188
-
189
-
190
-
191
-
192
-
193
-
194
-
195
-
196
-
197
-
198
-
199
-
200
-
201
-
202
-
203
-
204
-
205
-
206
-
207
-
208
-
209
-
210
-
211
-
212
-
213
-
214
-
215
-
216
-
217
-
218
-
219
-
220
-
221
-
222
-
223
-
224
-
225
-
226
-
227
-
228
-
229
-
230
-
231
-
232
-
233
-
234
-
235
-
236
-
237
-
238
-
239
-
240
-
241
-
242
-
243
-
244
-
245
-
246
-
247
-
248
-
249
-
250
-
251
-
252
-
253
-
254
-
255
-
256
-
257
-
258
-
259
-
260
-
261
-
262
-
263
-
264
-
265
-
266
-
267
-
268
-
269
-
270
-
271
-
272
-
273
-
274
-
275
-
276
-
277
-
278
-
279
-
280
-
281
-
282
-
283
-
284
-
285
-
286
-
287
-
288
-
289
-
290
-
291
-
292
-
293
-
294
-
295
-
296
-
297
-
298
-
299
-
300
-
301
-
302
-
303
-
304
-
305
-
306
-
307
-
308
-
309
-
310
-
311
-
312
-
313
-
314
-
315
-
316
-
317
-
318
-
319
-
320
-
321
-
322
-
323
-
324
-
 325
325 -
 326
326 -
 327
327 -
 328
328 -
 329
329 -
 330
330 -
 331
331 -
 332
332 -
 333
333 -
 334
334 -
 335
335 -
 336
336 -
 337
337 -
 338
338 -
 339
339 -
 340
340 -
 341
341 -
 342
342 -
 343
343 -
 344
344 -
 345
345 -
346
-
347
-
348
-
349
-
350
-
351
-
352
-
353
-
354
-
355
-
356
-
357
-
358
-
359
-
360
-
361
-
362
-
363
-
364
-
365
-
366
-
367
-
368
-
369
-
370
-
371
-
372
-
373
-
374
-
375
-
376
-
377
-
378
-
379
-
380
-
381
-
382
-
383
-
384
-
385
-
386
-
387
-
388
-
389
-
390
-
391
-
392
-
393
-
394
-
395
-
396
-
397
-
398
-
399
-
400
-
401
-
402
-
403
-
404
-
405
-
406
-
407
-
408
-
409
-
410
-
411
-
412
-
413
-
414
-
415
-
416
-
417
-
418
-
419
-
420
-
421
-
422
-
423
-
424
-
425
-
426
-
427
-
428
-
429
-
430
-
431
-
432
-
433
-
434
-
435
-
436
-
437
-
438
-
439
-
440
-
441
-
442
-
443
-
444
-
445
-
446
-
447
-
448
-
449
-
450
-
451
-
452
-
453
-
454
-
455
-
456
-
457
-
458
-
459
-
460
-
461
-
462
-
463
-
464
-
465
-
466
-
467
-
468
-
469
-
470
-
471
-
472
 |
 |

333
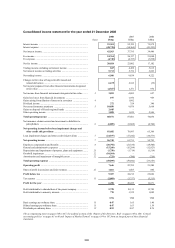
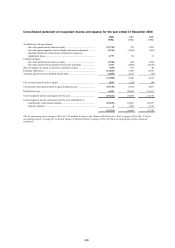
Consolidated income statement for the year ended 31 December 2008
2008 2007 2006
Notes US$m US$m US$m
Interest income .................................................................................... 91,301 92,359 75,879
Interest expense ................................................................................... (48,738) (54,564) (41,393)
Net interest income .............................................................................. 42,563 37,795 34,486
Fee income ........................................................................................... 24,764 26,337 21,080
Fee expense .......................................................................................... (4,740) (4,335) (3,898)
Net fee income ..................................................................................... 20,024 22,002 17,182
Trading income excluding net interest income ................................... 847 4,458 5,619
Net interest income on trading activities ............................................. 5,713 5,376 2,603
Net trading income .............................................................................. 6,560 9,834 8,222
Changes in fair value of long-term debt issued and
related derivatives ........................................................................... 6,679 2,812 (35)
Net income/(expense) from other financial instruments designated
at fair value ..................................................................................... (2,827) 1,271 692
Net income from financial instruments designated at fair value ........ 3 3,852 4,083 657
Gains less losses from financial investments ...................................... 197 1,956 969
Gains arising from dilution of interests in associates ......................... 4 –1,092 –
Dividend income .................................................................................. 272 324 340
Net earned insurance premiums .......................................................... 5 10,850 9,076 5,668
Gains on disposal of French regional banks ....................................... 2,445 – –
Other operating income ....................................................................... 1,808 1,439 2,546
Total operating income ..................................................................... 88,571 87,601 70,070
Net insurance claims incurred and movement in liabilities to
policyholders .................................................................................. 6 (6,889) (8,608) (4,704)
Net operating income before loan impairment charges and
other credit risk provisions .......................................................... 81,682 78,993 65,366
Loan impairment charges and other credit risk provisions ................. 7 (24,937) (17,242) (10,573)
Net operating income ........................................................................ 7 56,745 61,751 54,793
Employee compensation and benefits ................................................. 8 (20,792) (21,334) (18,500)
General and administrative expenses .................................................. (15,260) (15,294) (12,823)
Depreciation and impairment of property, plant and equipment ........ 23 (1,750) (1,714) (1,514)
Goodwill impairment ........................................................................... 22 (10,564) – –
Amortisation and impairment of intangible assets .............................. 22 (733) (700) (716)
Total operating expenses ................................................................... (49,099) (39,042) (33,553)
Operating profit ................................................................................. 7,646 22,709 21,240
Share of profit in associates and joint ventures ................................... 21 1,661 1,503 846
Profit before tax ................................................................................. 9,307 24,212 22,086
Tax expense ......................................................................................... 11 (2,809) (3,757) (5,215)
Profit for the year .............................................................................. 6,498 20,455 16,871
Profit attributable to shareholders of the parent company .................. 5,728 19,133 15,789
Profit attributable to minority interests ............................................... 770 1,322 1,082
US$ US$ US$
Basic earnings per ordinary share ....................................................... 13 0.47 1.65 1.40
Diluted earnings per ordinary share .................................................... 13 0.47 1.63 1.39
Dividends per ordinary share .............................................................. 12 0.93 0.87 0.76
The accompanying notes on pages 340
to 447, the audited sections of the ‘Report of the Directors: Risk’ on pages 188 to 280, ‘Critical
accounting policies’ on pages 61 to 66 and ‘Impact of Market Turmoil’ on pages 144 to 187 form an integral part of these financial
statements.