HSBC 2008 Annual Report Download - page 246
Download and view the complete annual report
Please find page 246 of the 2008 HSBC annual report below. You can navigate through the pages in the report by either clicking on the pages listed below, or by using the keyword search tool below to find specific information within the annual report.-
 1
1 -
2
-
3
-
4
-
5
-
6
-
7
-
8
-
9
-
10
-
11
-
12
-
13
-
14
-
15
-
16
-
17
-
18
-
19
-
20
-
21
-
22
-
23
-
24
-
25
-
26
-
27
-
28
-
29
-
30
-
31
-
32
-
33
-
34
-
35
-
36
-
37
-
38
-
39
-
40
-
41
-
42
-
43
-
44
-
45
-
46
-
47
-
48
-
49
-
50
-
51
-
52
-
53
-
54
-
55
-
56
-
57
-
58
-
59
-
60
-
61
-
62
-
63
-
64
-
65
-
66
-
67
-
68
-
69
-
70
-
71
-
72
-
73
-
74
-
75
-
76
-
77
-
78
-
79
-
80
-
81
-
82
-
83
-
84
-
85
-
86
-
87
-
88
-
89
-
90
-
91
-
92
-
93
-
94
-
95
-
96
-
97
-
98
-
99
-
100
-
101
-
102
-
103
-
104
-
105
-
106
-
107
-
108
-
109
-
110
-
111
-
112
-
113
-
114
-
115
-
116
-
117
-
118
-
119
-
120
-
121
-
122
-
123
-
124
-
125
-
126
-
127
-
128
-
129
-
130
-
131
-
132
-
133
-
134
-
135
-
136
-
137
-
138
-
139
-
140
-
141
-
142
-
143
-
144
-
145
-
146
-
147
-
148
-
149
-
150
-
151
-
152
-
153
-
154
-
155
-
156
-
157
-
158
-
159
-
160
-
161
-
162
-
163
-
164
-
165
-
166
-
167
-
168
-
169
-
170
-
171
-
172
-
173
-
174
-
175
-
176
-
177
-
178
-
179
-
180
-
181
-
182
-
183
-
184
-
185
-
186
-
187
-
188
-
189
-
190
-
191
-
192
-
193
-
194
-
195
-
196
-
197
-
198
-
199
-
200
-
201
-
202
-
203
-
204
-
205
-
206
-
207
-
208
-
209
-
210
-
211
-
212
-
213
-
214
-
215
-
216
-
217
-
218
-
219
-
220
-
221
-
222
-
223
-
224
-
225
-
226
-
227
-
228
-
229
-
230
-
231
-
232
-
233
-
234
-
235
-
 236
236 -
 237
237 -
 238
238 -
 239
239 -
 240
240 -
 241
241 -
 242
242 -
 243
243 -
 244
244 -
 245
245 -
 246
246 -
 247
247 -
 248
248 -
 249
249 -
 250
250 -
 251
251 -
 252
252 -
 253
253 -
 254
254 -
 255
255 -
 256
256 -
257
-
258
-
259
-
260
-
261
-
262
-
263
-
264
-
265
-
266
-
267
-
268
-
269
-
270
-
271
-
272
-
273
-
274
-
275
-
276
-
277
-
278
-
279
-
280
-
281
-
282
-
283
-
284
-
285
-
286
-
287
-
288
-
289
-
290
-
291
-
292
-
293
-
294
-
295
-
296
-
297
-
298
-
299
-
300
-
301
-
302
-
303
-
304
-
305
-
306
-
307
-
308
-
309
-
310
-
311
-
312
-
313
-
314
-
315
-
316
-
317
-
318
-
319
-
320
-
321
-
322
-
323
-
324
-
325
-
326
-
327
-
328
-
329
-
330
-
331
-
332
-
333
-
334
-
335
-
336
-
337
-
338
-
339
-
340
-
341
-
342
-
343
-
344
-
345
-
346
-
347
-
348
-
349
-
350
-
351
-
352
-
353
-
354
-
355
-
356
-
357
-
358
-
359
-
360
-
361
-
362
-
363
-
364
-
365
-
366
-
367
-
368
-
369
-
370
-
371
-
372
-
373
-
374
-
375
-
376
-
377
-
378
-
379
-
380
-
381
-
382
-
383
-
384
-
385
-
386
-
387
-
388
-
389
-
390
-
391
-
392
-
393
-
394
-
395
-
396
-
397
-
398
-
399
-
400
-
401
-
402
-
403
-
404
-
405
-
406
-
407
-
408
-
409
-
410
-
411
-
412
-
413
-
414
-
415
-
416
-
417
-
418
-
419
-
420
-
421
-
422
-
423
-
424
-
425
-
426
-
427
-
428
-
429
-
430
-
431
-
432
-
433
-
434
-
435
-
436
-
437
-
438
-
439
-
440
-
441
-
442
-
443
-
444
-
445
-
446
-
447
-
448
-
449
-
450
-
451
-
452
-
453
-
454
-
455
-
456
-
457
-
458
-
459
-
460
-
461
-
462
-
463
-
464
-
465
-
466
-
467
-
468
-
469
-
470
-
471
-
472
 |
 |

HSBC HOLDINGS PLC
Report of the Directors: Risk (continued)
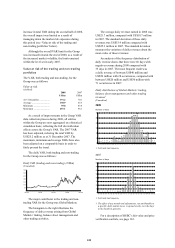
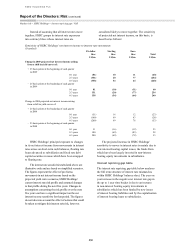
Market risk > Trading portfolios / Non-trading portfolios
244
Trading portfolios
(Audited)
HSBC’s control of market risk is based on a policy
of restricting individual operations to trading within
a list of permissible instruments authorised for each
site by Traded Credit and Market Risk, of enforcing
rigorous new product approval procedures, and of
restricting trading in the more complex derivative
products only to offices with appropriate levels of
product expertise and robust control systems.
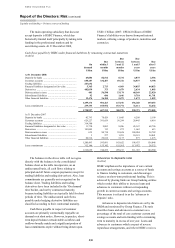
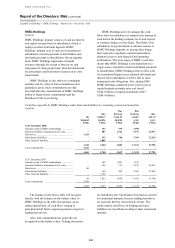
Market making and proprietary position taking
is undertaken within Global Markets. The VAR for
such trading activity at 31 December 2008 was
US$72.5 million (2007: US$30.2 million). This is
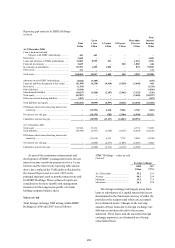
analysed below by risk type:
VAR by risk type for the trading activities (excluding Credit Spread VAR)
(Audited)
Foreign
exchange and
commodity
Interest
rate
Equity Total1
US$m US$m US$m US$m
At 31 December 2008 .................................................. 29.8 63.4 13.9 72.5
At 31 December 20072 .................................................. 10.7 25.4 10.2 30.2
Average
2008 .......................................................................... 19.0 50.7 15.2 53.1
20072 ......................................................................... 9.5 22.9 7.9 23.7
Minimum
2008 .......................................................................... 8.7 21.4 8.2 22.6
20072 ......................................................................... 4.0 14.9 3.4 14.3
Maximum
2008 .......................................................................... 54.9 147.4 39.0 104.4
20072 ......................................................................... 23.0 36.1 15.1 38.8
1 The total VAR is non-additive across risk types due to diversification effects.
2 The VAR for 2007 has been adjusted on the same basis as Group VAR on page 243.
Credit spread risk
The risk associated with movements in credit
spreads is primarily managed through sensitivity
limits, stress testing, and VAR for those portfolios
where VAR is calculated.
The Group is introducing credit spread as a
separate risk type within the VAR models. At
31 December 2008, credit spread VAR was
calculated for the London trading and New York
credit derivatives portfolios. At that date, the total
VAR for the trading activities, including credit
spread VAR for the above portfolios, was
US$106.4 million (2007: US$43.8 million)
compared with a total VAR of US$72.5 million
reported within the ‘VAR by risk type for the
trading activities’ (see above), which excludes the
credit spread VAR for these two portfolios.
The sensitivity of trading income to the effect
of movements in credit spreads on the total trading
activities of the Group was US$590.9 million at
31 December 2008 (2007: US$95.4 million). This
sensitivity captures the credit spread exposure
arising from positions taken throughout the Group,
in addition to the London trading and New York
credit derivative portfolios captured within credit
spread VAR (see above). The sensitivity was
calculated using simplified assumptions based on
one-day movements in average market credit spreads
over a two-year period at a confidence level of
99 per cent, and assumes a simultaneous movement
in credit spreads across issuers. It should be noted
that diversification effects within the portfolio and
with other risk types is likely to lead to a reduced
impact on trading income.
The significant increase in the sensitivity at
31 December 2008, compared with 31 December
2007, was due to the effect of much higher volatility
in credit spreads observed during 2008. The actual
positions within the trading portfolios exposed to
credit spread risk were lower on 31 December 2008
than on 31 December 2007.
In addition to the above measure certain
portfolios are also managed using default risk
measures where appropriate.
The measurement of the credit spread impact on
trading income as at 31 December 2008 excludes
those positions that were reclassified as non-trading
during the second half of 2008 following the
amendment to IFRS. These positions are included
within the 31 December 2007 comparative, as the
reclassification took effect from 1 July 2008.
Credit spread risk also arises on credit derivative
transactions entered into by Global Banking in order
to manage the risk concentrations within the
corporate loan portfolio and so enhance capital