HSBC 2008 Annual Report Download - page 275
Download and view the complete annual report
Please find page 275 of the 2008 HSBC annual report below. You can navigate through the pages in the report by either clicking on the pages listed below, or by using the keyword search tool below to find specific information within the annual report.-
 1
1 -
2
-
3
-
4
-
5
-
6
-
7
-
8
-
9
-
10
-
11
-
12
-
13
-
14
-
15
-
16
-
17
-
18
-
19
-
20
-
21
-
22
-
23
-
24
-
25
-
26
-
27
-
28
-
29
-
30
-
31
-
32
-
33
-
34
-
35
-
36
-
37
-
38
-
39
-
40
-
41
-
42
-
43
-
44
-
45
-
46
-
47
-
48
-
49
-
50
-
51
-
52
-
53
-
54
-
55
-
56
-
57
-
58
-
59
-
60
-
61
-
62
-
63
-
64
-
65
-
66
-
67
-
68
-
69
-
70
-
71
-
72
-
73
-
74
-
75
-
76
-
77
-
78
-
79
-
80
-
81
-
82
-
83
-
84
-
85
-
86
-
87
-
88
-
89
-
90
-
91
-
92
-
93
-
94
-
95
-
96
-
97
-
98
-
99
-
100
-
101
-
102
-
103
-
104
-
105
-
106
-
107
-
108
-
109
-
110
-
111
-
112
-
113
-
114
-
115
-
116
-
117
-
118
-
119
-
120
-
121
-
122
-
123
-
124
-
125
-
126
-
127
-
128
-
129
-
130
-
131
-
132
-
133
-
134
-
135
-
136
-
137
-
138
-
139
-
140
-
141
-
142
-
143
-
144
-
145
-
146
-
147
-
148
-
149
-
150
-
151
-
152
-
153
-
154
-
155
-
156
-
157
-
158
-
159
-
160
-
161
-
162
-
163
-
164
-
165
-
166
-
167
-
168
-
169
-
170
-
171
-
172
-
173
-
174
-
175
-
176
-
177
-
178
-
179
-
180
-
181
-
182
-
183
-
184
-
185
-
186
-
187
-
188
-
189
-
190
-
191
-
192
-
193
-
194
-
195
-
196
-
197
-
198
-
199
-
200
-
201
-
202
-
203
-
204
-
205
-
206
-
207
-
208
-
209
-
210
-
211
-
212
-
213
-
214
-
215
-
216
-
217
-
218
-
219
-
220
-
221
-
222
-
223
-
224
-
225
-
226
-
227
-
228
-
229
-
230
-
231
-
232
-
233
-
234
-
235
-
236
-
237
-
238
-
239
-
240
-
241
-
242
-
243
-
244
-
245
-
246
-
247
-
248
-
249
-
250
-
251
-
252
-
253
-
254
-
255
-
256
-
257
-
258
-
259
-
260
-
261
-
262
-
263
-
264
-
 265
265 -
 266
266 -
 267
267 -
 268
268 -
 269
269 -
 270
270 -
 271
271 -
 272
272 -
 273
273 -
 274
274 -
 275
275 -
 276
276 -
 277
277 -
 278
278 -
 279
279 -
 280
280 -
 281
281 -
 282
282 -
 283
283 -
 284
284 -
 285
285 -
286
-
287
-
288
-
289
-
290
-
291
-
292
-
293
-
294
-
295
-
296
-
297
-
298
-
299
-
300
-
301
-
302
-
303
-
304
-
305
-
306
-
307
-
308
-
309
-
310
-
311
-
312
-
313
-
314
-
315
-
316
-
317
-
318
-
319
-
320
-
321
-
322
-
323
-
324
-
325
-
326
-
327
-
328
-
329
-
330
-
331
-
332
-
333
-
334
-
335
-
336
-
337
-
338
-
339
-
340
-
341
-
342
-
343
-
344
-
345
-
346
-
347
-
348
-
349
-
350
-
351
-
352
-
353
-
354
-
355
-
356
-
357
-
358
-
359
-
360
-
361
-
362
-
363
-
364
-
365
-
366
-
367
-
368
-
369
-
370
-
371
-
372
-
373
-
374
-
375
-
376
-
377
-
378
-
379
-
380
-
381
-
382
-
383
-
384
-
385
-
386
-
387
-
388
-
389
-
390
-
391
-
392
-
393
-
394
-
395
-
396
-
397
-
398
-
399
-
400
-
401
-
402
-
403
-
404
-
405
-
406
-
407
-
408
-
409
-
410
-
411
-
412
-
413
-
414
-
415
-
416
-
417
-
418
-
419
-
420
-
421
-
422
-
423
-
424
-
425
-
426
-
427
-
428
-
429
-
430
-
431
-
432
-
433
-
434
-
435
-
436
-
437
-
438
-
439
-
440
-
441
-
442
-
443
-
444
-
445
-
446
-
447
-
448
-
449
-
450
-
451
-
452
-
453
-
454
-
455
-
456
-
457
-
458
-
459
-
460
-
461
-
462
-
463
-
464
-
465
-
466
-
467
-
468
-
469
-
470
-
471
-
472
 |
 |

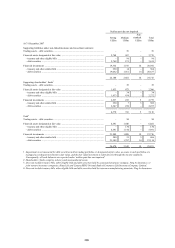
273
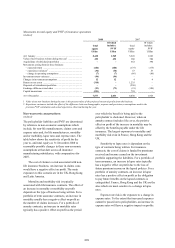
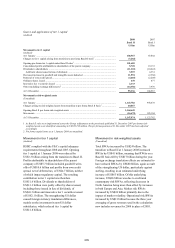
Movements in total equity and PVIF of insurance operations
(Audited)
2008 2007
Total
equity
Of which
includes:
PVIF
Total
equity
Of which
includes:
PVIF
US$m US$m US$m US$m
At 1 January ............................................................................... 8,430 1,965 5,949 1,549
Value of new business written during the year1 ........................ 452 452 380 380
Acquisitions of subsidiaries/portfolios ...................................... – – 652 390
Movements arising from in-force business:
– expected return ................................................................... (186) (186) (175) (175)
– experience variances2 ......................................................... (36) (36) 53 53
– change in operating assumptions ....................................... (7) (7) (86) (86)
Investment return variances ....................................................... (94) (94) – –
Changes in investment assumptions .......................................... 12 12 4 4
Return on net assets ................................................................... (310) – 1,235 –
Disposals of subsidiaries/portfolios .......................................... – – (250) –
Exchange differences and other ................................................ (93) (73) (91) (150)
Capital transactions ................................................................... (591) – 759 –
At 31 December ......................................................................... 7,577 2,033 8,430 1,965
1 Value of net new business during the year is the present value of the projected stream of profits from the business.
2 Experience variances include the effect of the difference between demographic, expense and persistency assumptions used in the
previous PVIF calculation and actual experience observed during the year.
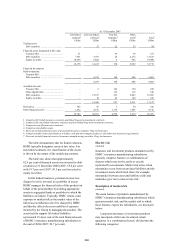
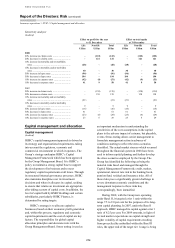
Non-economic assumptions
(Audited)
The policyholder liabilities and PVIF are determined
by reference to non-economic assumptions which
include, for non-life manufacturers, claims costs and
expense rates and, for life manufacturers, mortality
and/or morbidity, lapse rates and expense rates. The
table below shows the sensitivity of profit for the
year to, and total equity at, 31 December 2008 to
reasonably possible changes in these non-economic
assumptions at that date across all insurance
manufacturing subsidiaries, with comparatives for
2007.
The cost of claims is a risk associated with non-
life insurance business. An increase in claims costs
would have a negative effect on profit. The main
exposures to this scenario are in the UK, Hong Kong
and Latin America.
Mortality and morbidity risk is typically
associated with life insurance contracts. The effect of
an increase in mortality or morbidity on profit
depends on the type of business being written. For a
portfolio of term assurance contracts, an increase in
mortality usually has a negative effect on profit as
the number of claims increases. For a portfolio of
annuity contracts, an increase in mortality rates
typically has a positive effect on profit as the period
over which the benefit is being paid to the
policyholder is shortened. However, when an
annuity contract includes life cover, the positive
effect on profit of the increase in mortality may be
offset by the benefits payable under the life
insurance. The largest exposures to mortality and
morbidity risk exist in France, Hong Kong and the
UK.
Sensitivity to lapse rates is dependent on the
type of contracts being written. For insurance
contracts, the cost of claims is funded by premiums
received and income earned on the investment
portfolio supporting the liabilities. For a portfolio of
term assurance, an increase in lapse rates typically
has a negative effect on profit due to the loss of
future premium income on the lapsed policies. For a
portfolio of annuity contracts, an increase in lapse
rates has a positive effect on profit as the obligation
to pay future benefits on the lapsed contracts is
extinguished. France, Hong Kong and the UK are the
sites which are most sensitive to a change in lapse
rates.
Expense rate risk is the exposure to a change in
expense rates. To the extent that increased expenses
cannot be passed on to policyholders, an increase in
expense rates will have a negative impact on profits.